Check in other modules:
Contents
1. About - Overview - Website Map 2. PubAD -Inhouse NLP Section -CTD Data 3. GeneAD -Single Gene Query -Multiple Gene Query 4. ToolboxAD -ID Converter -PCA Plot -OnlineGSEA -External Tools 5. TargetAD 6. DataAD 7. Case Study -GSEA Sample Project 8. FAQADE Documentation
1. About
1.1 Overview
Alzheimer's Disease Explorer (ADE) is an open website focusing on Alzheimer’s disease research providing bioinformatic data and tool support for scientists in the neurodegenerative disease (ND) field. ADE incorporates literature query, customizable data processing and analysis, as well as drug target information. With all bioinformatic tools and resources provided in ADE, we aim to provide an one-stop web portal to facilitate AD and ND field researchers to address the challenges of searching AD/ND-drug-development related information and analysis results from huge number of publications. ADE serves as the first of its kind bioinformatics server which focuses on AD research and provide rich bioinformatics support by utilizing literature, omics and chemical data.
1.2 Website Map
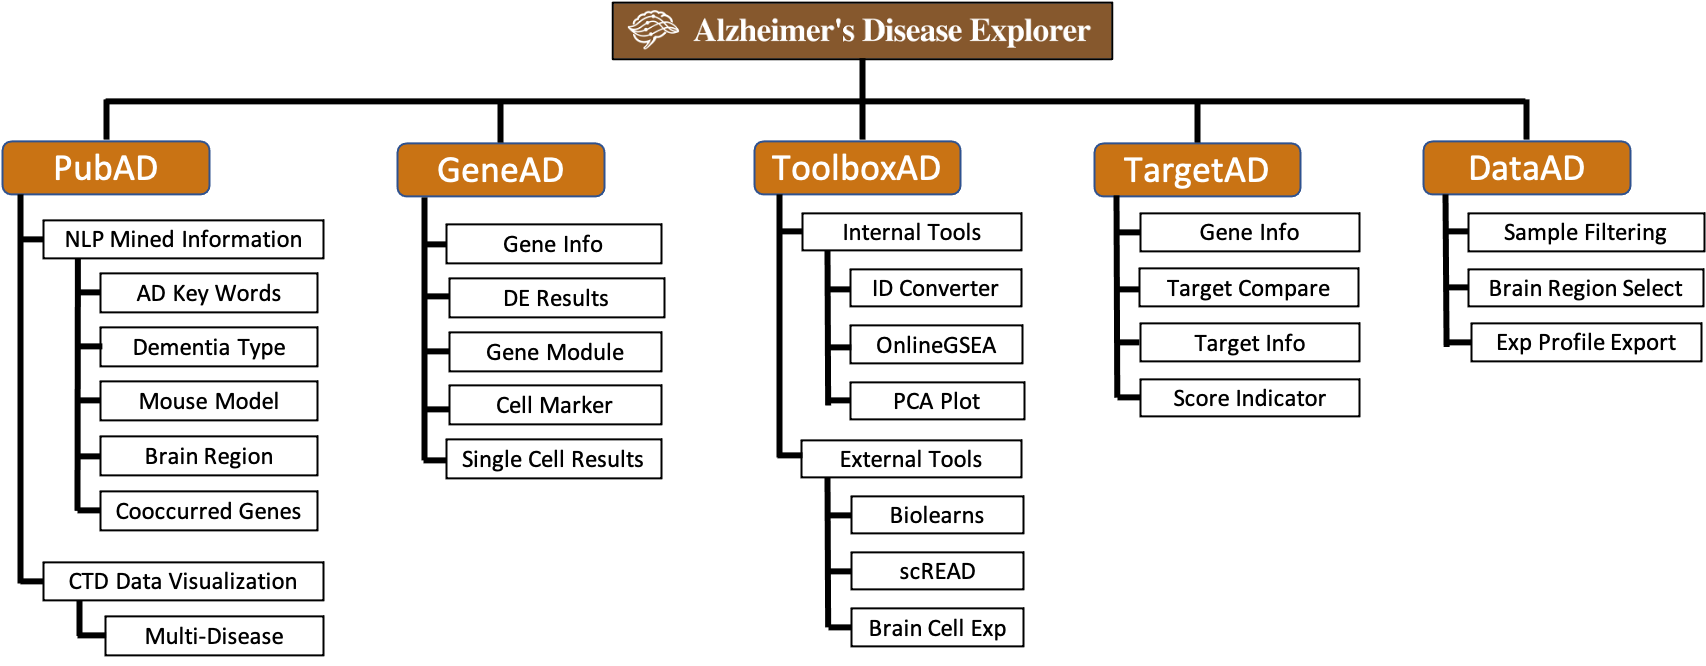
ADE is structured with the next generation bioinformatics platform framework (NGBP), it is developed to provided full research life cycle bioinformatics support for researchers in ND field. ADE is implemented with Django and PostgreSQL, the following site mape describes all functional modules in ADE:
2. PubAD
PubAD provides an innovative query tool for exploring ND-related publications under multiple search criteria. Our in-house natural language processing pipeline processed millions of publication in PubMed database and extracted useful information related to ND research, the extracted information is store in our structured database. PubAD also provides data visualizations for CTD database, ND-related disease information are extracted form CTD database and visualized with D3.js.
- 2.1 Inhouse NLP Pipeline Mined Information
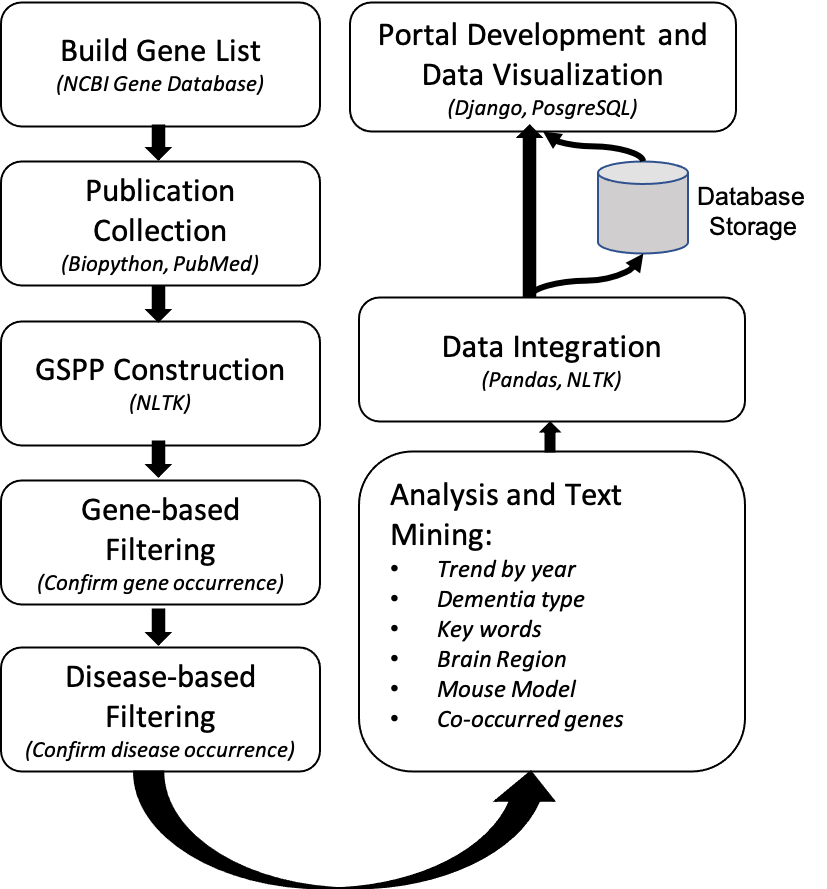
The source data we used for this section is collected from PubMed database, we constructed gene specific publication profiles for 20k common genes and filtered out publications that are not focused on ND-related diseases. Then we performed information extraction for each gene's publication profile, five main categories of information are extracted from publication's title and abstract, these five main categories are: key words, dementia types, brain regions, mouse models and co-occurring genes (data processing workflow shown on right). All extracted information are summarized in a tabular format and is stored in the SQL database. Details of information extraction are introduced below:
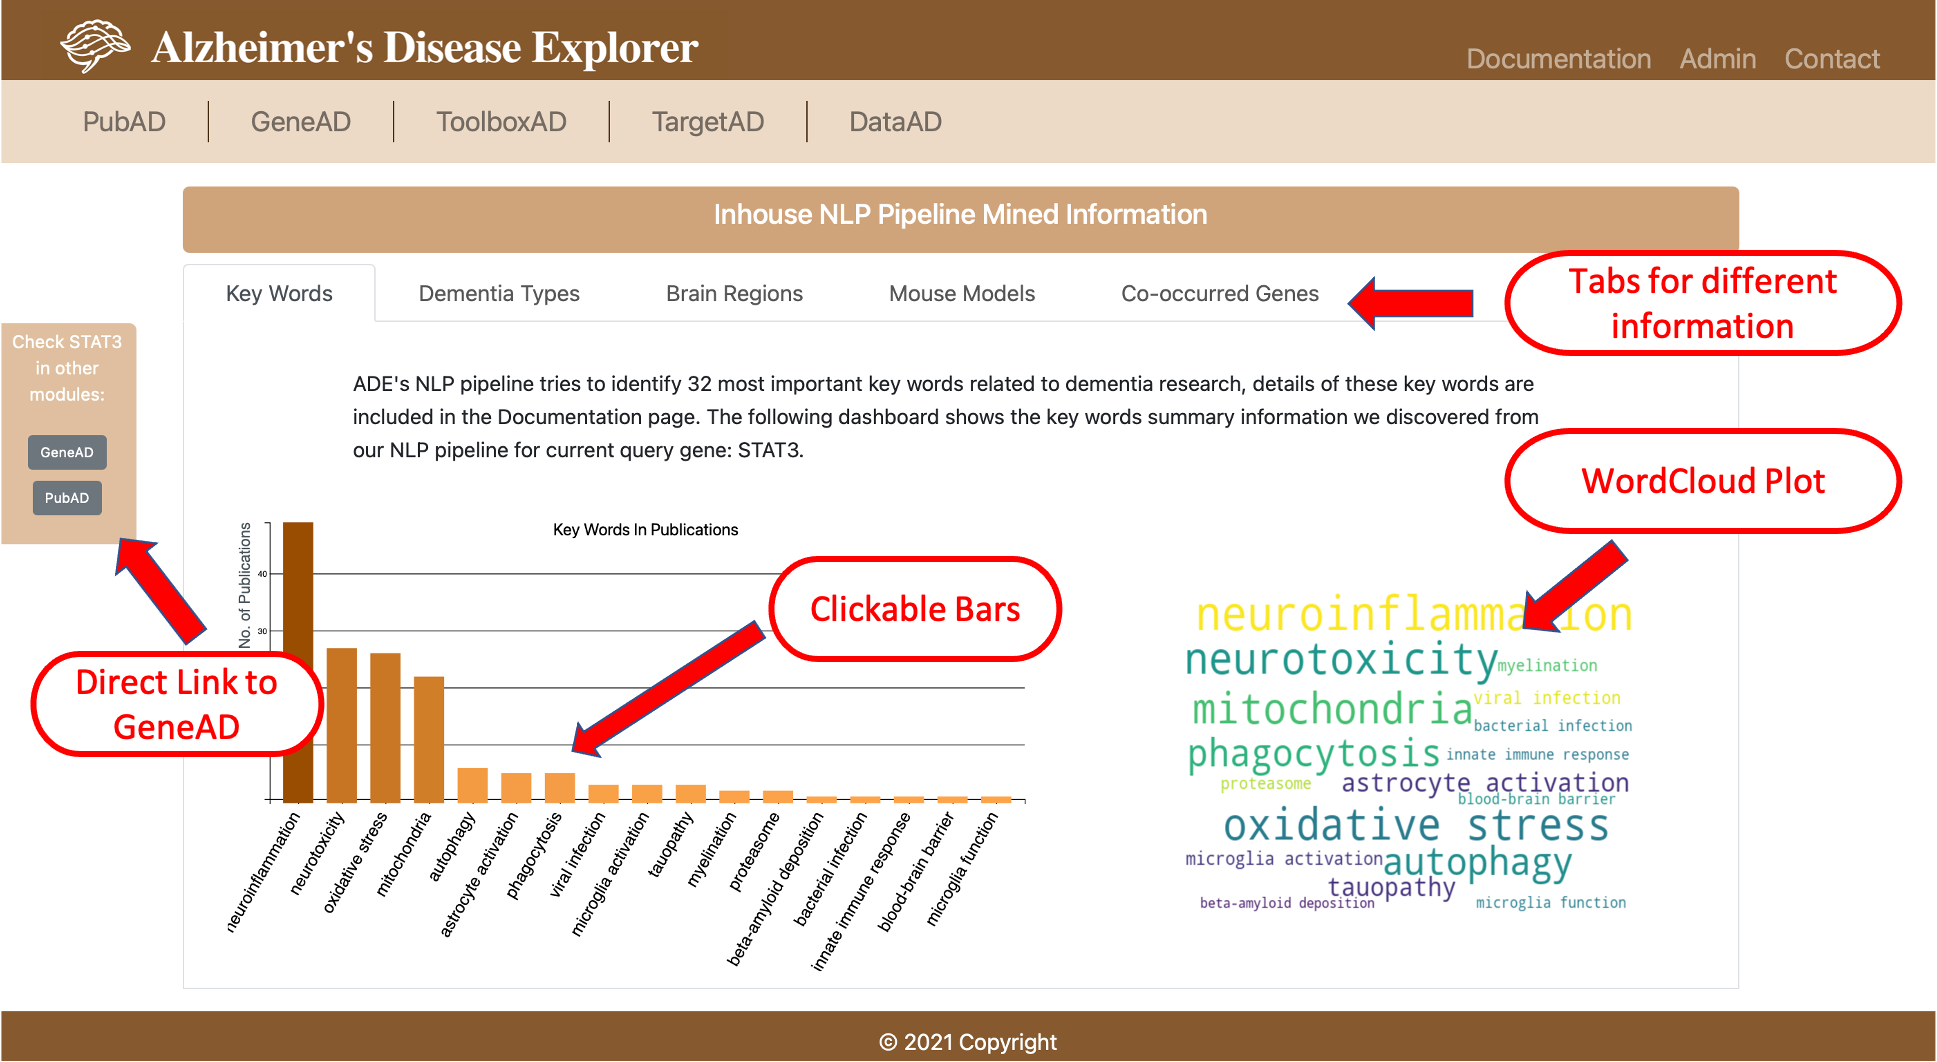
- Key words: our AD research experts identified 32 representative keywords related to AD research, including lysosome, proteasome, endosome, mitochondria, ubiquitination, phagocytosis, autophagy, myelination, ferroptosis, neuroinflammation, tauopathy, neurotoxicity, microglia function, microglia activation, astrocyte activation, lipid metabolism, fatty acid metabolism, oxidative stress, iron homeostasis, vesicle transport, protein trafficking, blood-brain barrier, chronical inflammation, innate immune response, viral/bacterial infection, viral infection, bacterial infection, beta-amyloid deposition, tau deposition, tau-related pathology, TDP-43 deposition, synaptic damage.
- Dementia types: total of 8 dementia types are used in our information extraction step, they are Alzheimer's disease, Huntington's disease, Parkinson's disease, Lewy body dementia, frontotemporal dementia, vascular dementia, mixed dementia and Progressive supranuclear palsy.
- Brain regions: 13 brain regions are used in our NLP pipeline, they are neocortex, hippocampus, cerebellum, amygdala,thalamus, hypothalamus, spinal cord, basal ganglia, prefrontal cortex, corpus callosum, brain stem, pituitary gland, cingulate gyrus.
- Mouse models: 29 currently available mouse models are included in our NLP pipeline, they are 5XFAD, APP/PS1, 3XTg-AD, hAbeta/APOE4/Trem2*R47H, APOE4/Trem*R47H, APOE4 KI, APOE3 KI, hAbeta KI, hAbeta-loxP-KI, App KO, Trem2*R47H, Trem2*Y38C, Trem2 KO, floxed Trem2, Abca7*A1527G, Abca7 KO, Ceacam1 KO, Clasp2*L163P, hCR1 KI, Il1rap exon 2 KO, Kif21b*T82T, Mthfr*C677T, Plcg2*M28L, Plcg2*P522R, Plcg2 KO, Shc2*V433M SNP, Slc6a17*P61P SNP, Snx1*D465N SNP, Sorl1 A528T SNP. Detailed mouse model information can be found at MODEL-AD's website
Based on the extracted information, various visualizations are created. Users can use the search box on the top of PubAD to query the gene they are interested in. On the result page, top section shows the basic gene information sucha as aliases, gene location, etc. then a bar plot shows the number of publications related to the query gene in recent years, users can click each bar to view all publications in a certain year. The inhouse NLP pipeline section provides five tabs showing different categories of information, all bars of bar plots in this section are clickable, so that users can check original publications on PubMed website.
- 2.2 Dementia Related Information in CTD Database
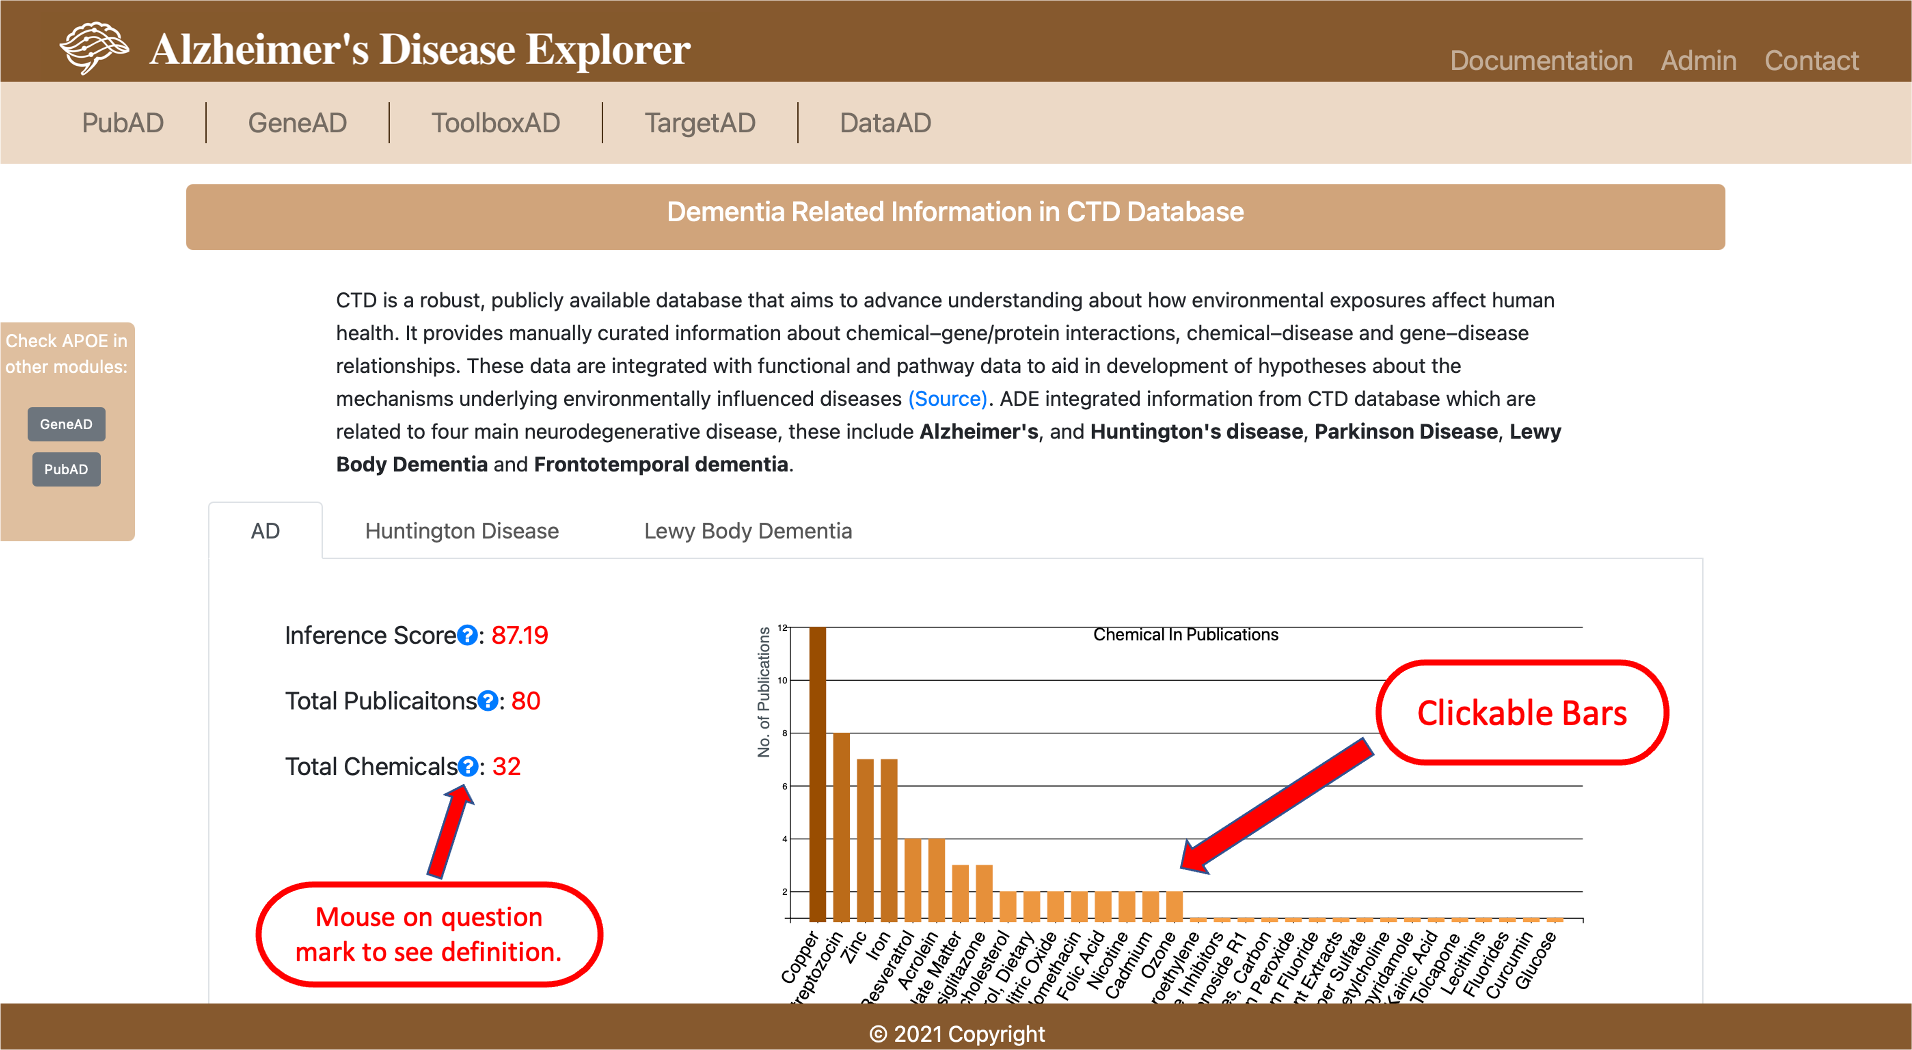
We downloaded the gene disease inference data from CTD database, then we filtered the dataset with five common ND diseases, these five diseases include Alzheimer's, and Huntington's disease, Parkinson Disease, Lewy Body Dementia and Frontotemporal dementia. Then we processed the data into tabular format to record the PMIDs and corresponding gene-chemical pairs, the processed dataset is stored in the SQL database. A bar plot visualization is provided with number of publications related to each chemical, the inference score indicates the degree of similarity between CTD chemical–gene–disease networks and a similar scale-free random network. The higher the score, the more likely the inference network has atypical connectivity. Users can use this data to investigate the environment chemicals relationship to the ND diseases and the relationship to a certain gene.
3. GeneAD
- 3.1 Single Gene Query
GeneAD provides single gene query capability to show various genomic information we collected and processed from multiple resources, each category of the information is shown in a tab in the result page. These categories include basic gene information, differentially expressed (DE) gene results, gene module information, cell type marker information and single cell data DE results. Detailed description of information in each tab is provided below:
- Basic gene information shows the basic gene information such as gene aliases, chromosom location, etc. The information is collected from NCBI Gene Database, a direct link the the query gene's PubAD search result page is also provided.
-
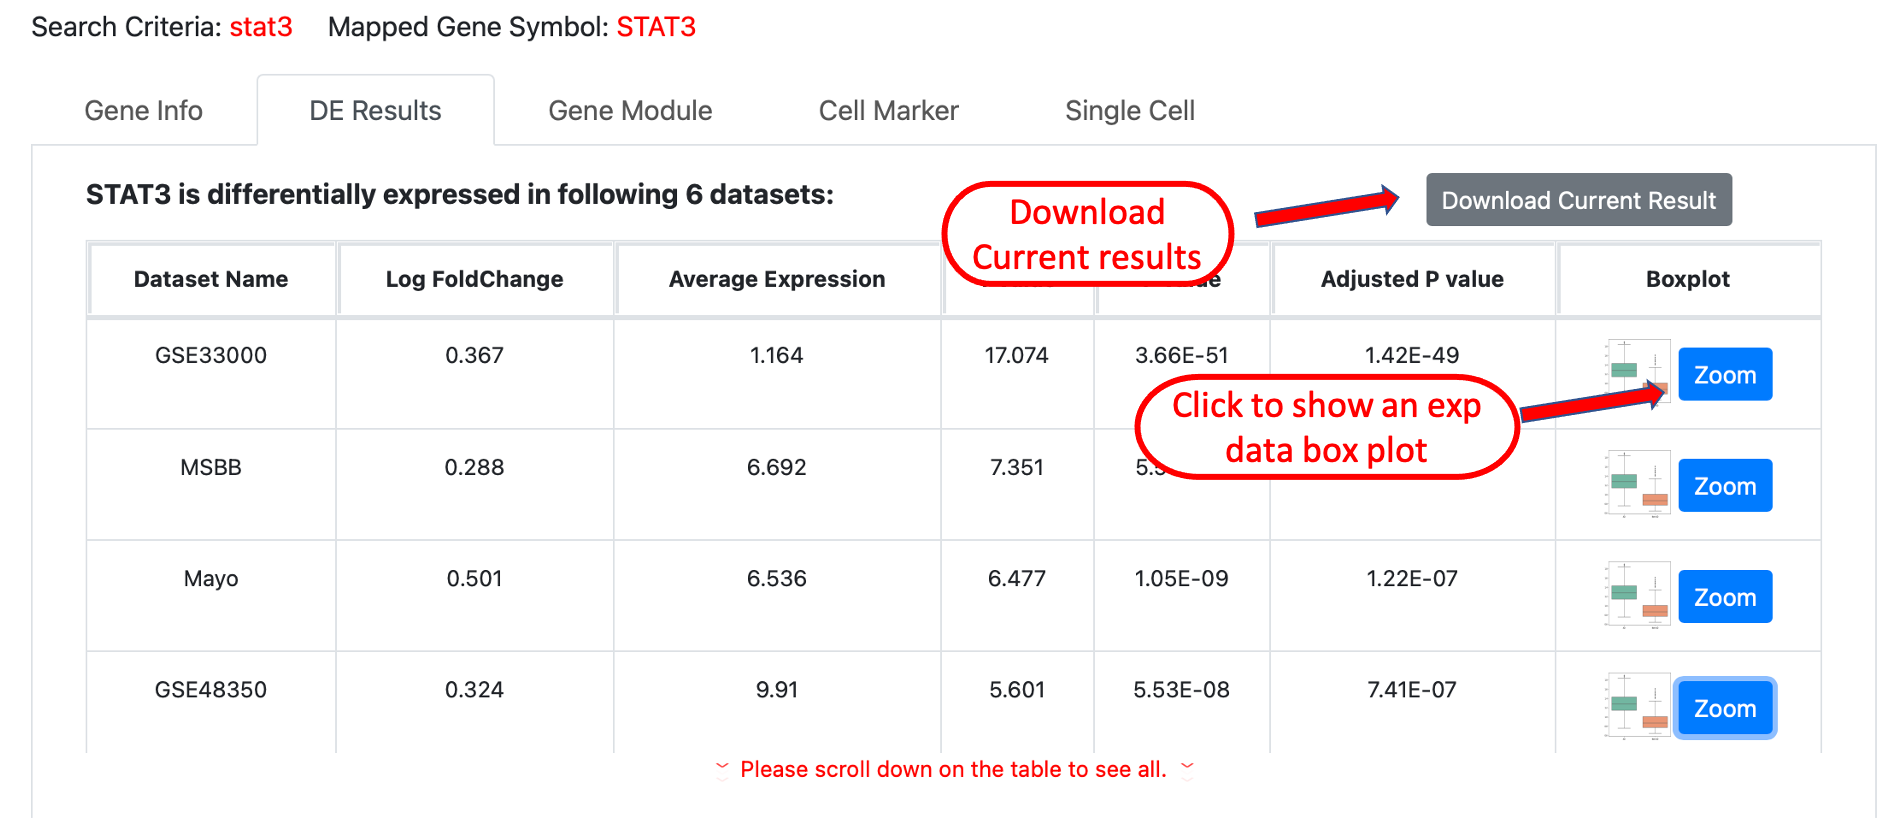
DE results shows the differentially expressed gene results in different datasets, if the query gene is a significant DE gene,
it will be listed in the table, the comparison setup used for calculating the DE result is AD vs Normal for each dataset, the significance
cutoff for P values is 0.05. In the last column of the table, uses can click the Zoom button to show a box plot of query gene's gene expression
level comparison between AD and Normal samples, please note that not all results will provide this box plot due to the data usage restrictions.
Users are also allowed to download the DE result by clicking the Download Current Result button on the top right of the table, data will
be downloaded to a csv file.
-
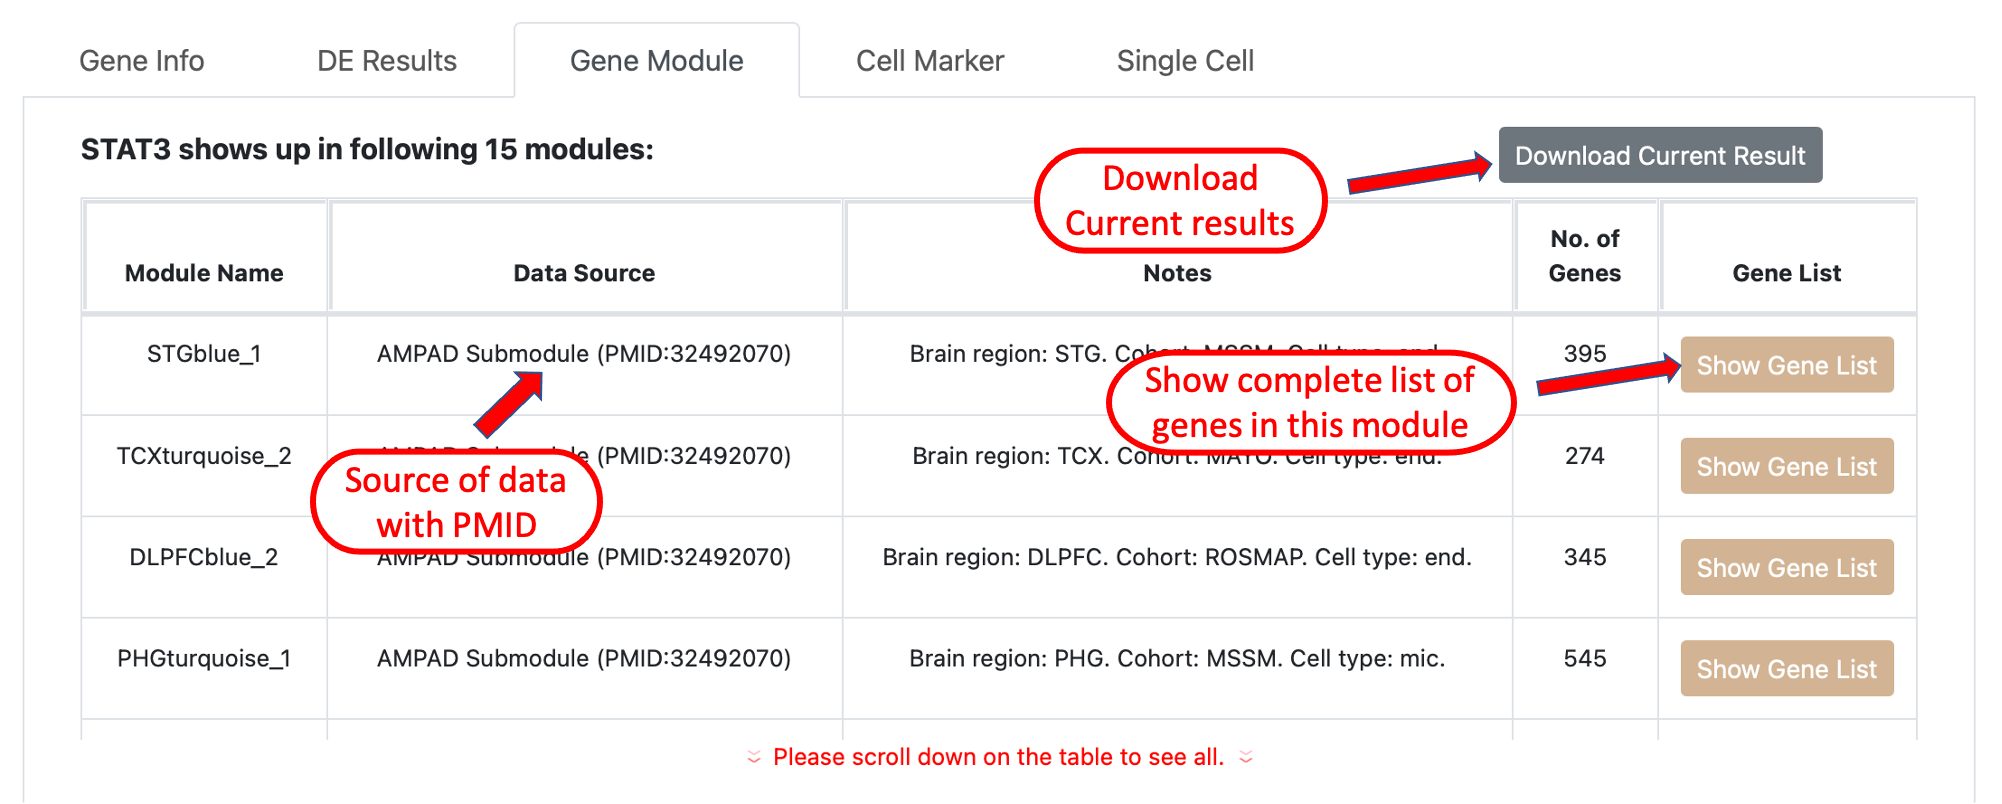
Gene module results shows the gene co-expression network modules generated from AD bulk tissue RNA sequencing data and
clinical traits-correlated functional gene modules that include the current query gene. The button on the last column will show a
whole list of genes included in a specific module. the results can be downloaded to a csv file by clicking the button on top right of the
table.
- Cell Marker provides information on whether the query gene can be a potential marker for a certain cell type, we collected this information from multiple resources and the data source is indicated in the first column of the result table. Please note some cell markers information is generated from mouse model, please refer to the last column of the table for details.
-
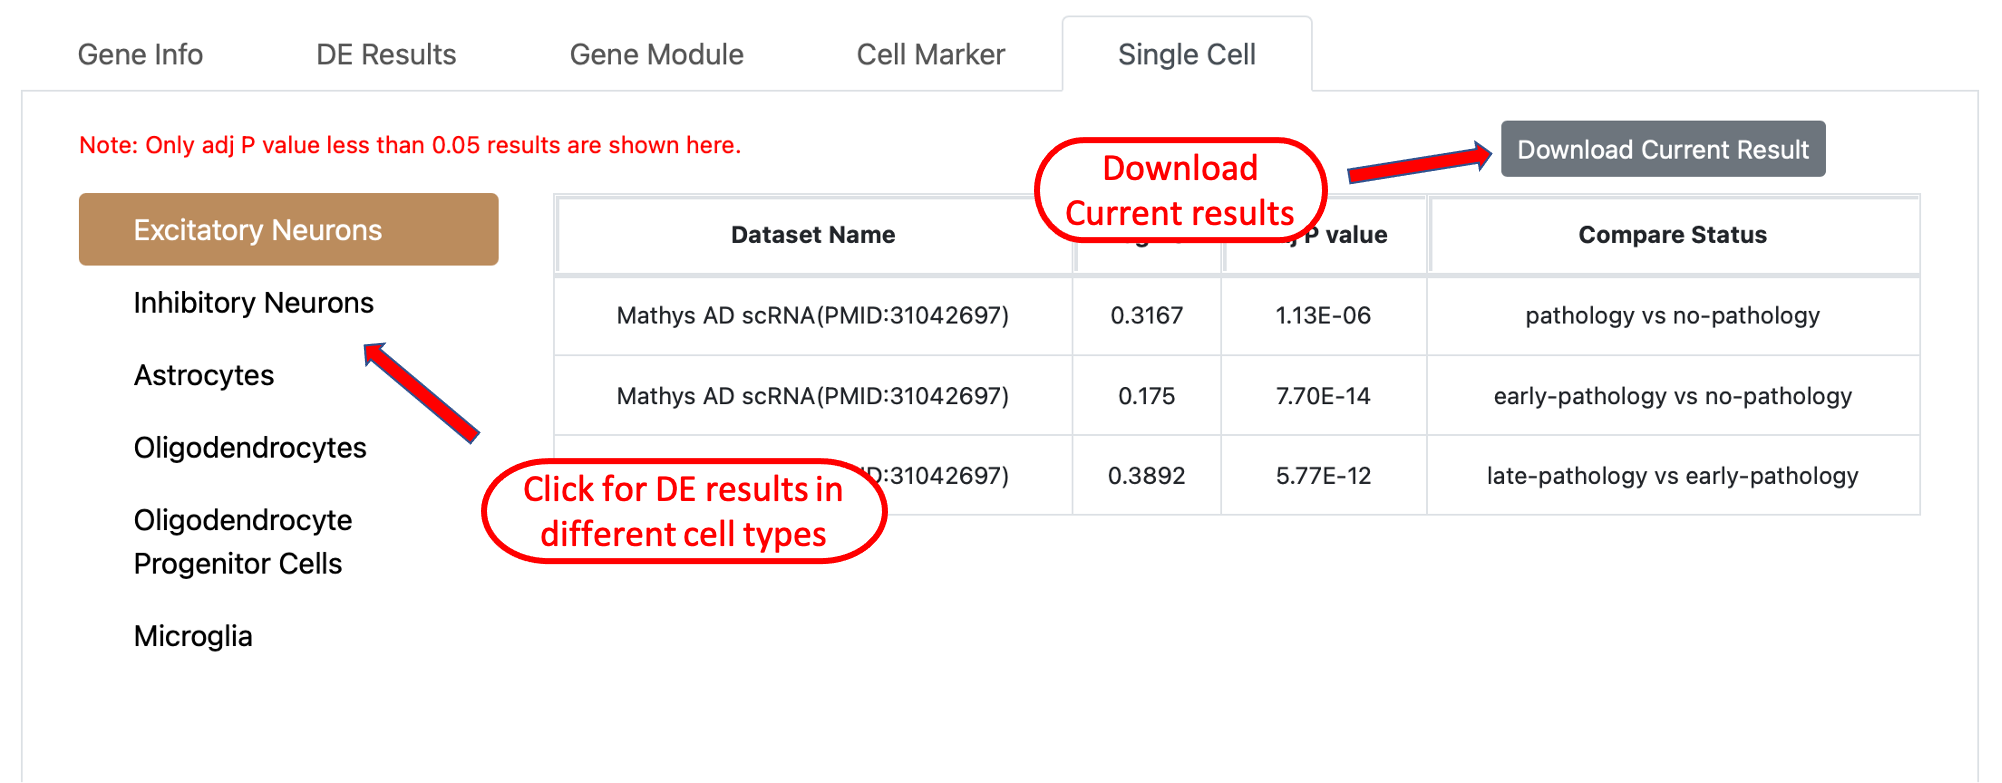
Single Cell tab provides the DE results generated from AD related single cell datasets, it will show if the current query gene is
a significant DE gene in a certain cell type, the experiment setup used for DE analysis is shown in the last column, users can download
the result by clicking the button on the top right of the table.
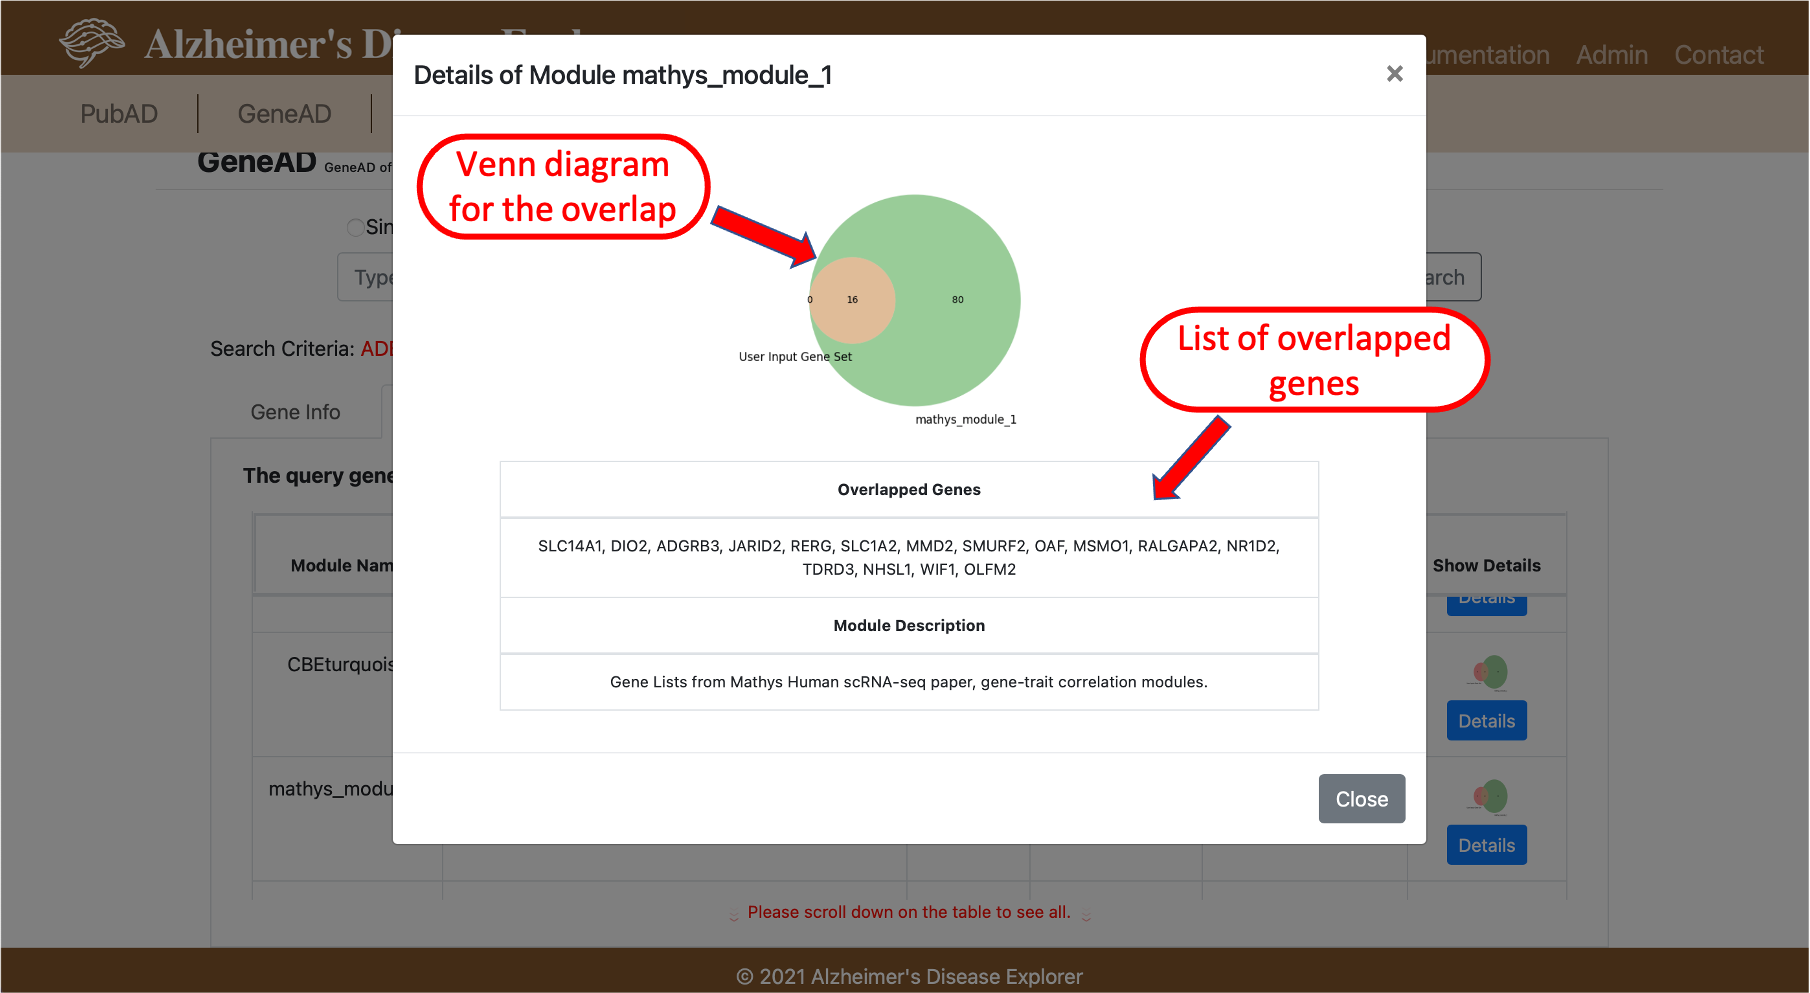
- 3.2 Multiple Gene Query
GeneAD also provides the capability for query a list of genes, users will need to select the multiple gene query button on the top of the search box. The query results are mostly the same as the single gene query, all resulting information is arrange into individule tabs to be shown in each category of information. The different part is the gene module tab, in the gene module results, ADE will perform the fisher exact test using the query gene set against all available gene modules in the system, only significantly overlapped gene modules will be shown in the results. A venn diagram is provided to visualize the overlap between the query gene set with gene modules in the system.
4. ToolboxAD
ToolboxAD provides multiple customizable bioinformatic tools for AD related transcriptomic datasets. Users can convert gene IDs among multiple database IDs, construct specific patient cohorts and perform Principal Component Analysis or Gene Set Enrichment Analysis with simple button clicks. The links to external resources provide more tools such as gene coexpression network module mining, gene expression levels in specific brain cell types. More tools are currently under development to better utilize the integrated data in ADE.
- 4.1 ID Converter
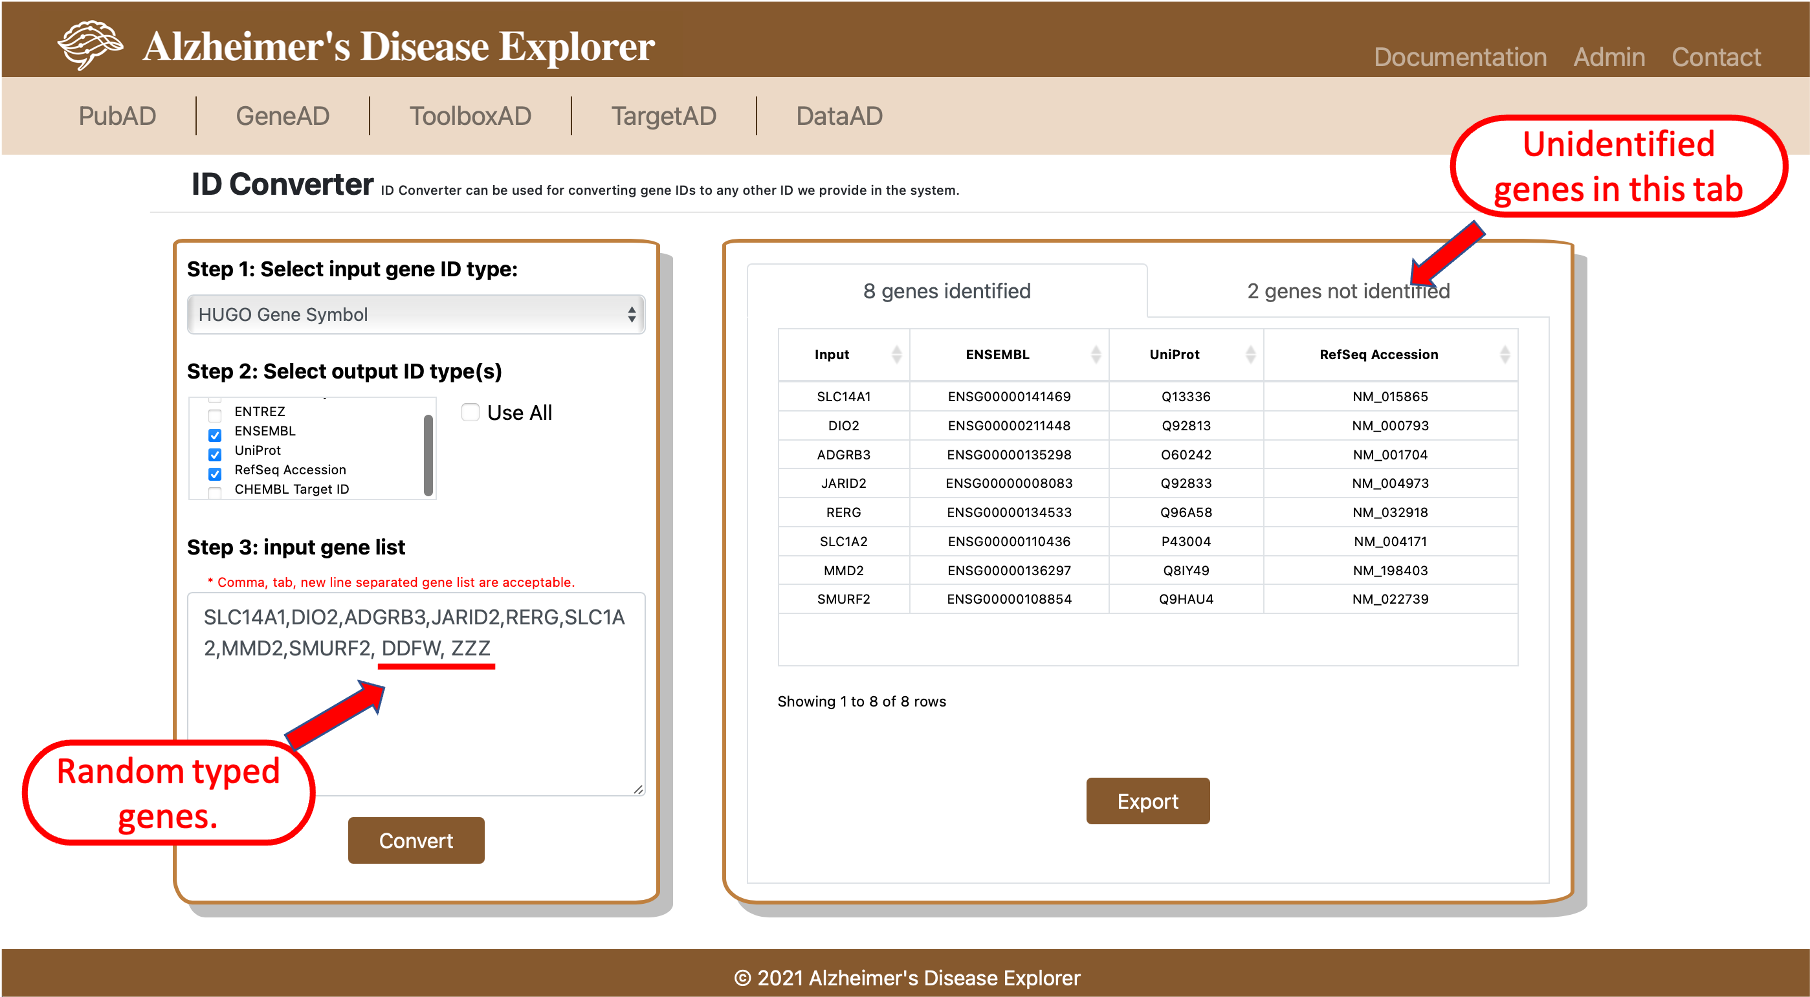
ID Converter is a our internal tool for converting various gene IDs. Gene ID mapping across different gene naming databases has always been a issue for biological researchers, since we have already collected and integrated most types of gene names in our backend database, we decided to develop a user friendly tool to help with converting gene names. Gene IDs that are available in ADE include HUGO Gene Symbol, ENTREZ, ENSEMBL, UniProt, RefSeq Accession and CHEMBL target ID. TO use the tool, first step is to provide the input genes(s) ID type. Then users need to select which gene IDs are expected to be converted to for query gene(s). The third step is to provide the gene(s). Comma, tab, new line separated gene list are acceptable as the input of ID Converter. Once the query is submitted by clicking the convert button, genes that are identified by the system will be shown in the first tab on the right side of the page. Genes that are not identified will be shown on the second tab, if similar genes are identified in the system, gene recommendations will be listed in the second column of unidentified gene(s) table. By clicking the Export button, a csv file will be downloaded, the first column of the csv file is the user input gene list, all following columns are corresponding output ID types selected by user.
- 4.2 PCA Plot
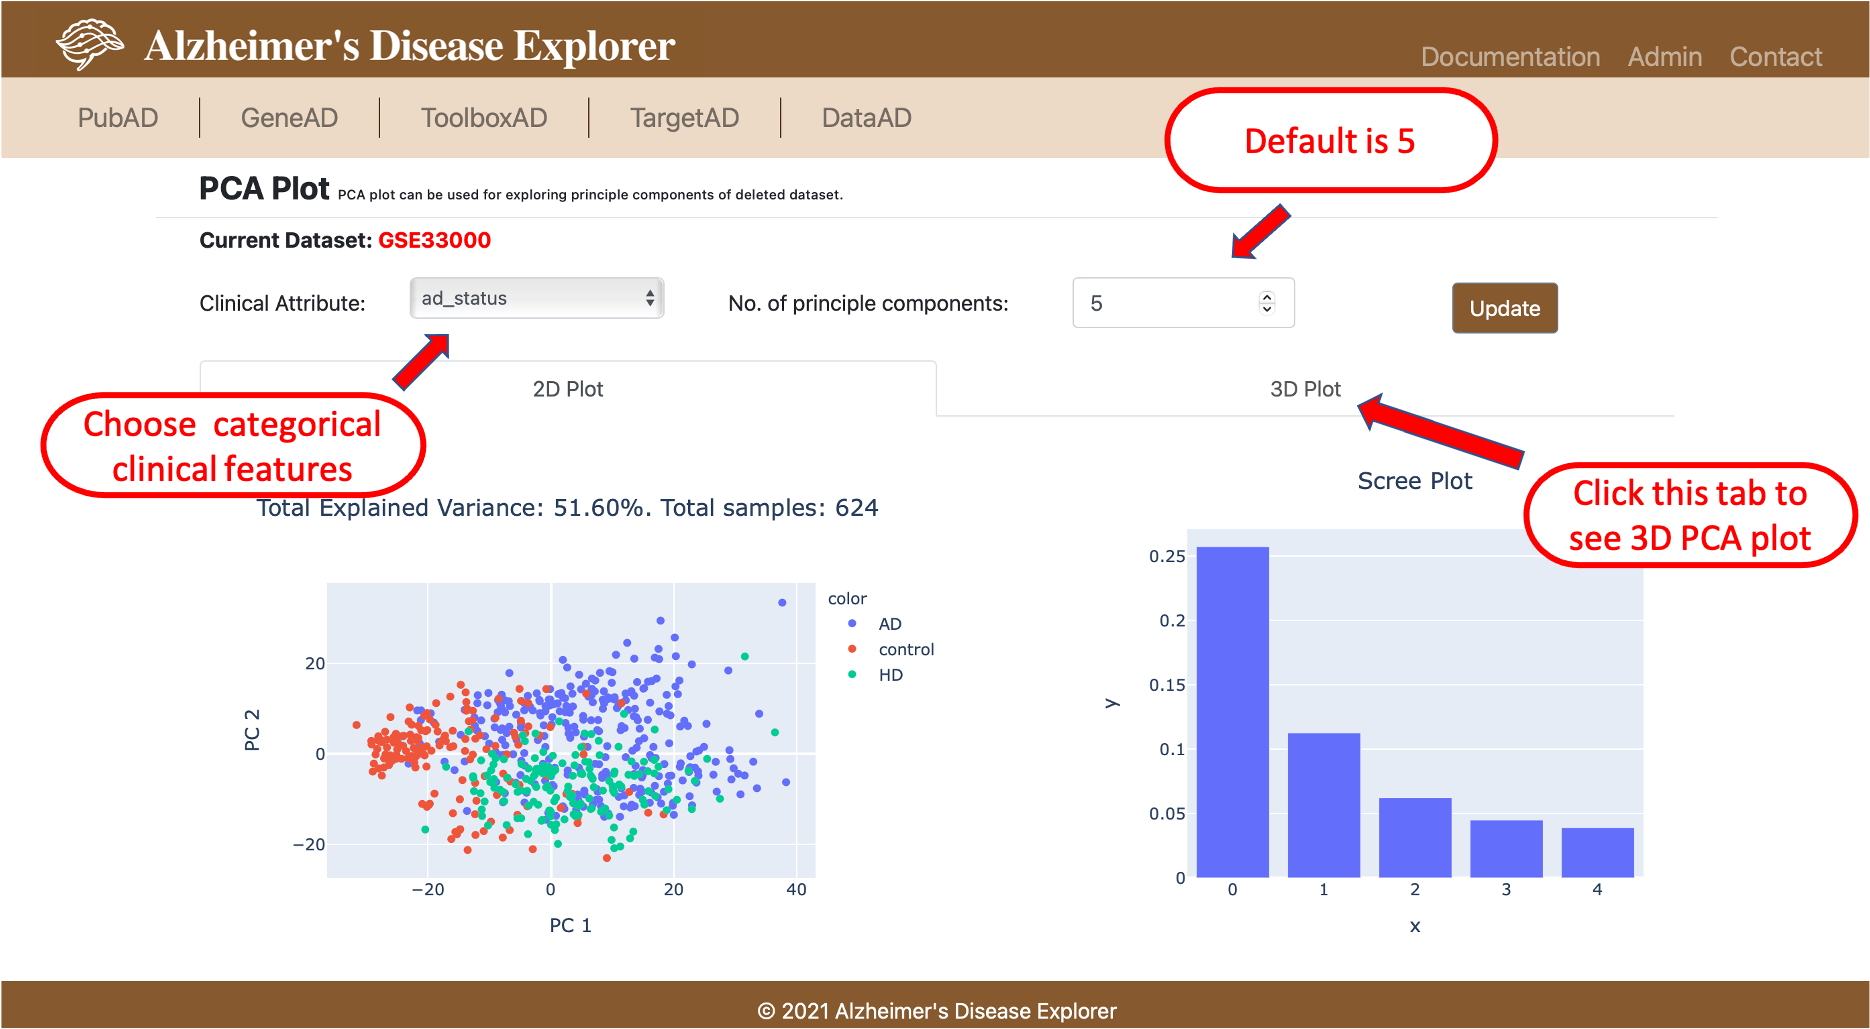
PCA Plot is our internal tool that can be used for exploring integrated RNA expression profiles in ADE, with a few clicks, users can run principle component analysis (PCA) and generate PCA plot (2D and 3D) and scree plot to visually checke the variance of the expression profile, users can also color code the data points in PCA plot with categorical clinical features, this will help with better understanding the expression profile for downstream analysis.
To use the PCA Plot, users firstly needs to select a dataset they want to work with, then select a method for filtering out samples in a dataset (currently only using all samples available), then the system will perform PCA and plot PCA plots (2D and 3D) and scree plot. On the result page, users can modify the color coding schema of the PCA plot with a dropdown selection menu, all available categorical clinical features are listed, users can also modifie the expected number of principle components, the default number is 5. Once all parameters are adjusted, users can click Update button on right to update both 2D and 3D PCA plots.
- 4.3 OnlineGSEA
The OnlineGSEA integrated AD gene expression profiles with Gene Set Enrichment Analysis (GSEA), with a well designed user interface, users can easily setup GSEA experiments with available clinic features of patients to investigate the enriched pathways. The OnlineGSEA eased the data preparation effort of researchers and greatly shortened the GSEA setup time.
To use OnlineGSEA, users firstly need to select a dataset to work with, then select a method for setting up the experim ent. Two data preparation methods are offered for OnlineGSEA:
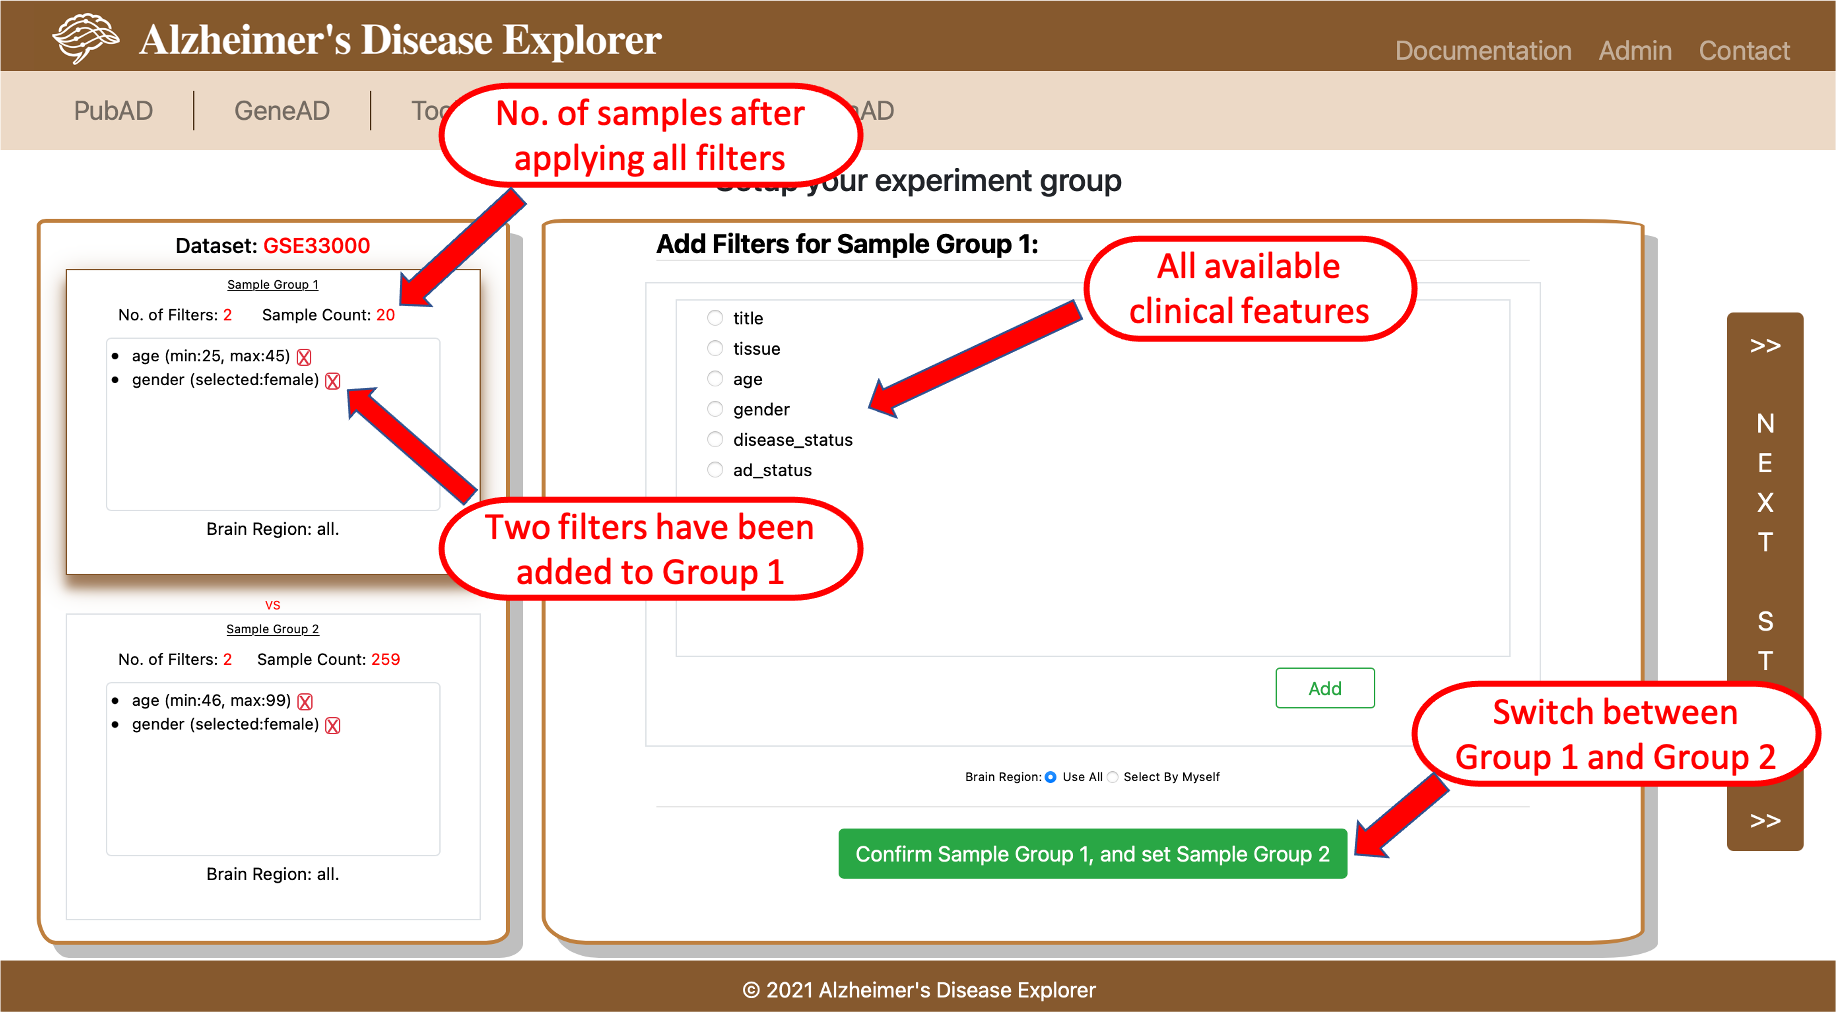
1. Use clinical features to set up test/control groups: when select this data prepare method a new page with test/control group setup functions will be displayed (shown below). On the setup experiment group page, users firstly need to set up the samples in the group1 by adding filters to selected dataset, all available clinical features are listed on the right side box of the page. Once choosing a clinical feature and click Add button, a pop-up window will allow users to provide desired parameters for a certain clinical feature. Because most AD datasets will sequence multiple brain regions for a patient, the bottom of the right side box also provides select buttons allow users to select the desired brain region (if brain region information is available for the selected dataset). The top box on the left side of the page monitors the filters that are already applied and number of samples left after applying all filters. Please note, when setting up the group 1 filters, top box on left is highlighted. Once user finished the group 1 setup, they can click the green button on the lower part of the page to switch to the setup for group 2, now the bottom box on left side of page should be highlighted, users now can add filters to setup group 2 samples. If the system detected overlapped sample(s) between group 1 an group 2 when adding a filter, this filter is not able to be added, a warning message will be displayed. Once all filters are added, the vertical button on the far right side of the page will be clickable to proceed to the next step.
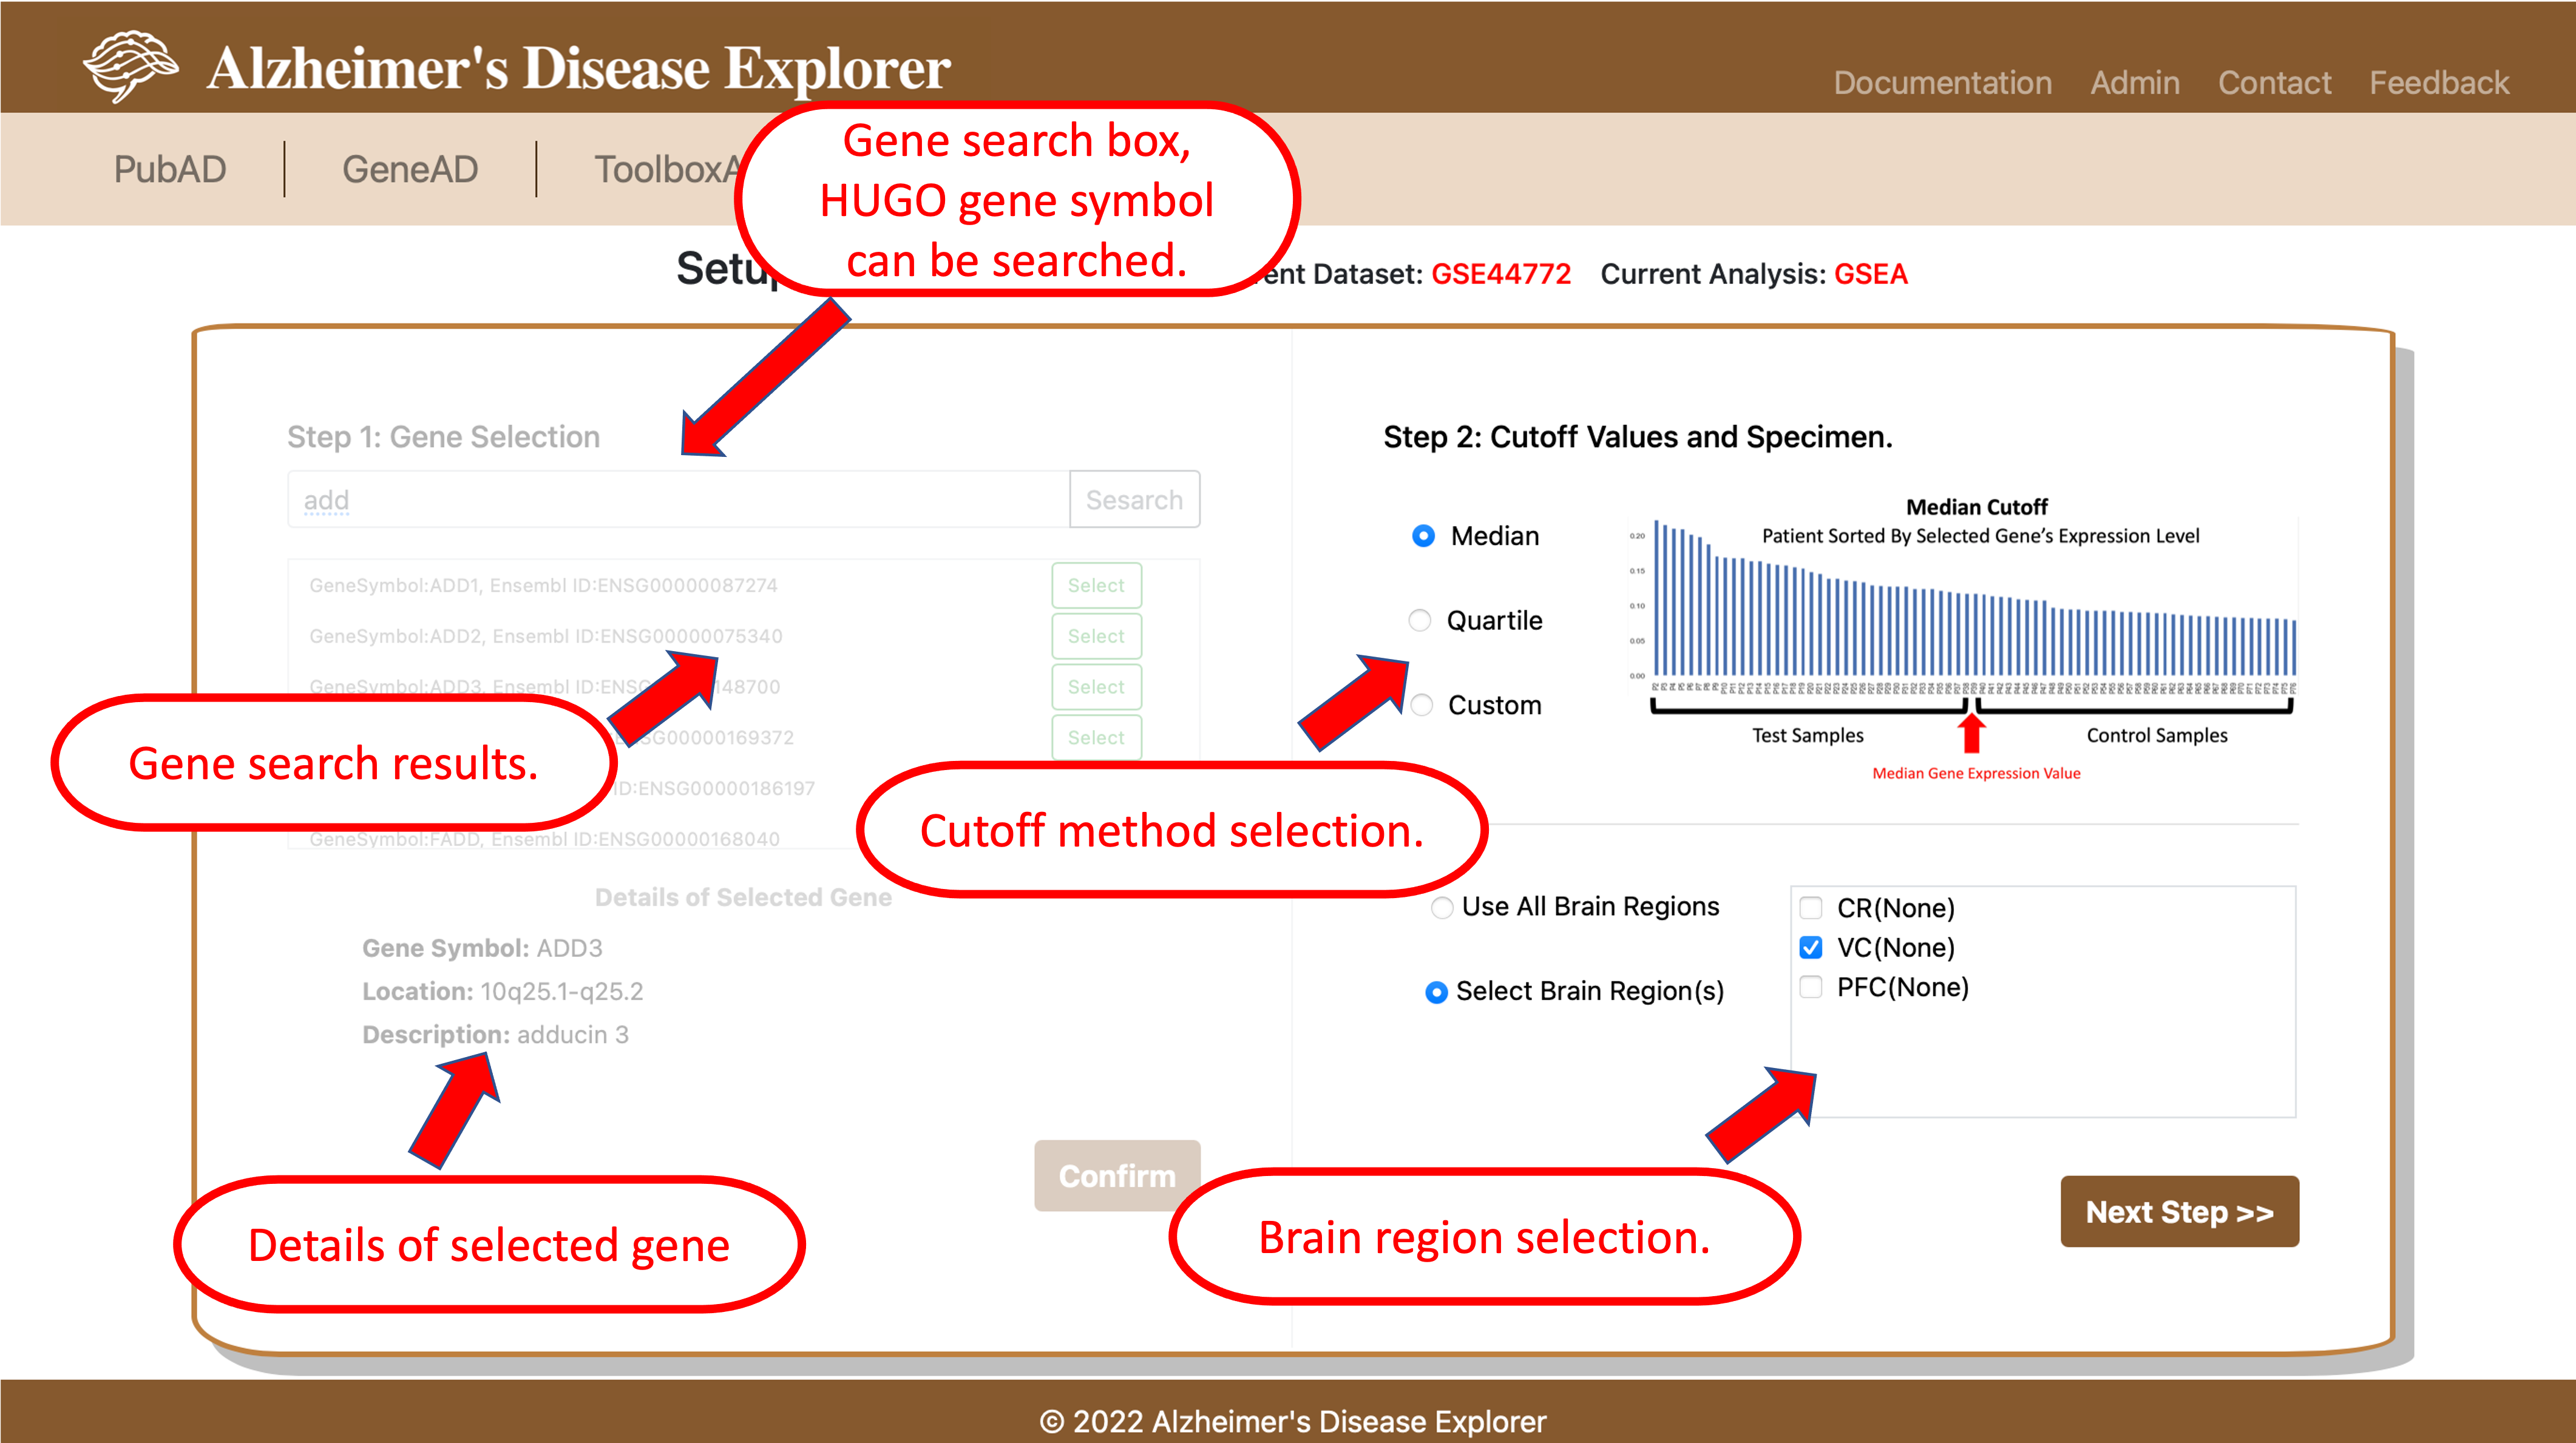
2. User single gene's expression level to make test/control groups. By using this method, users can select a gene from selected dataset, by using the search box shown on the left side of the page, gene symbols of the current dataset can be searched. In the result box below the search box, users can use the green button to select the gene they are interested in, once a gene is selected, its detailed information will show below. Then users need to click the confirm button to go to step 2 for setting up the threshold for dividing the samples of current datase. Three type of cutoffs are offerred, users can use median or quartile values to separate sample to assemble test/control groups. User can also customize a low and a high cutoff for sample preparation. Then, if users are interested in certain brain regions, they can choose specific brain regions or choose use all to use all available brain regions included in current dataset. Once all parameters are set up, users can click Next Step to go to GSEA settings page.
The next step is to setup parameters to run GSEA, all parameters have been assigned a default value, users can modify according to their needs. Once all parameters are setup, users will need to confirm the analysis. OnlineGSEA provides a optional emailing function to send analysis IDs to the user. Once analysis is confirmed, a unique ID will be provided for users to view and retrieve the analysis result.
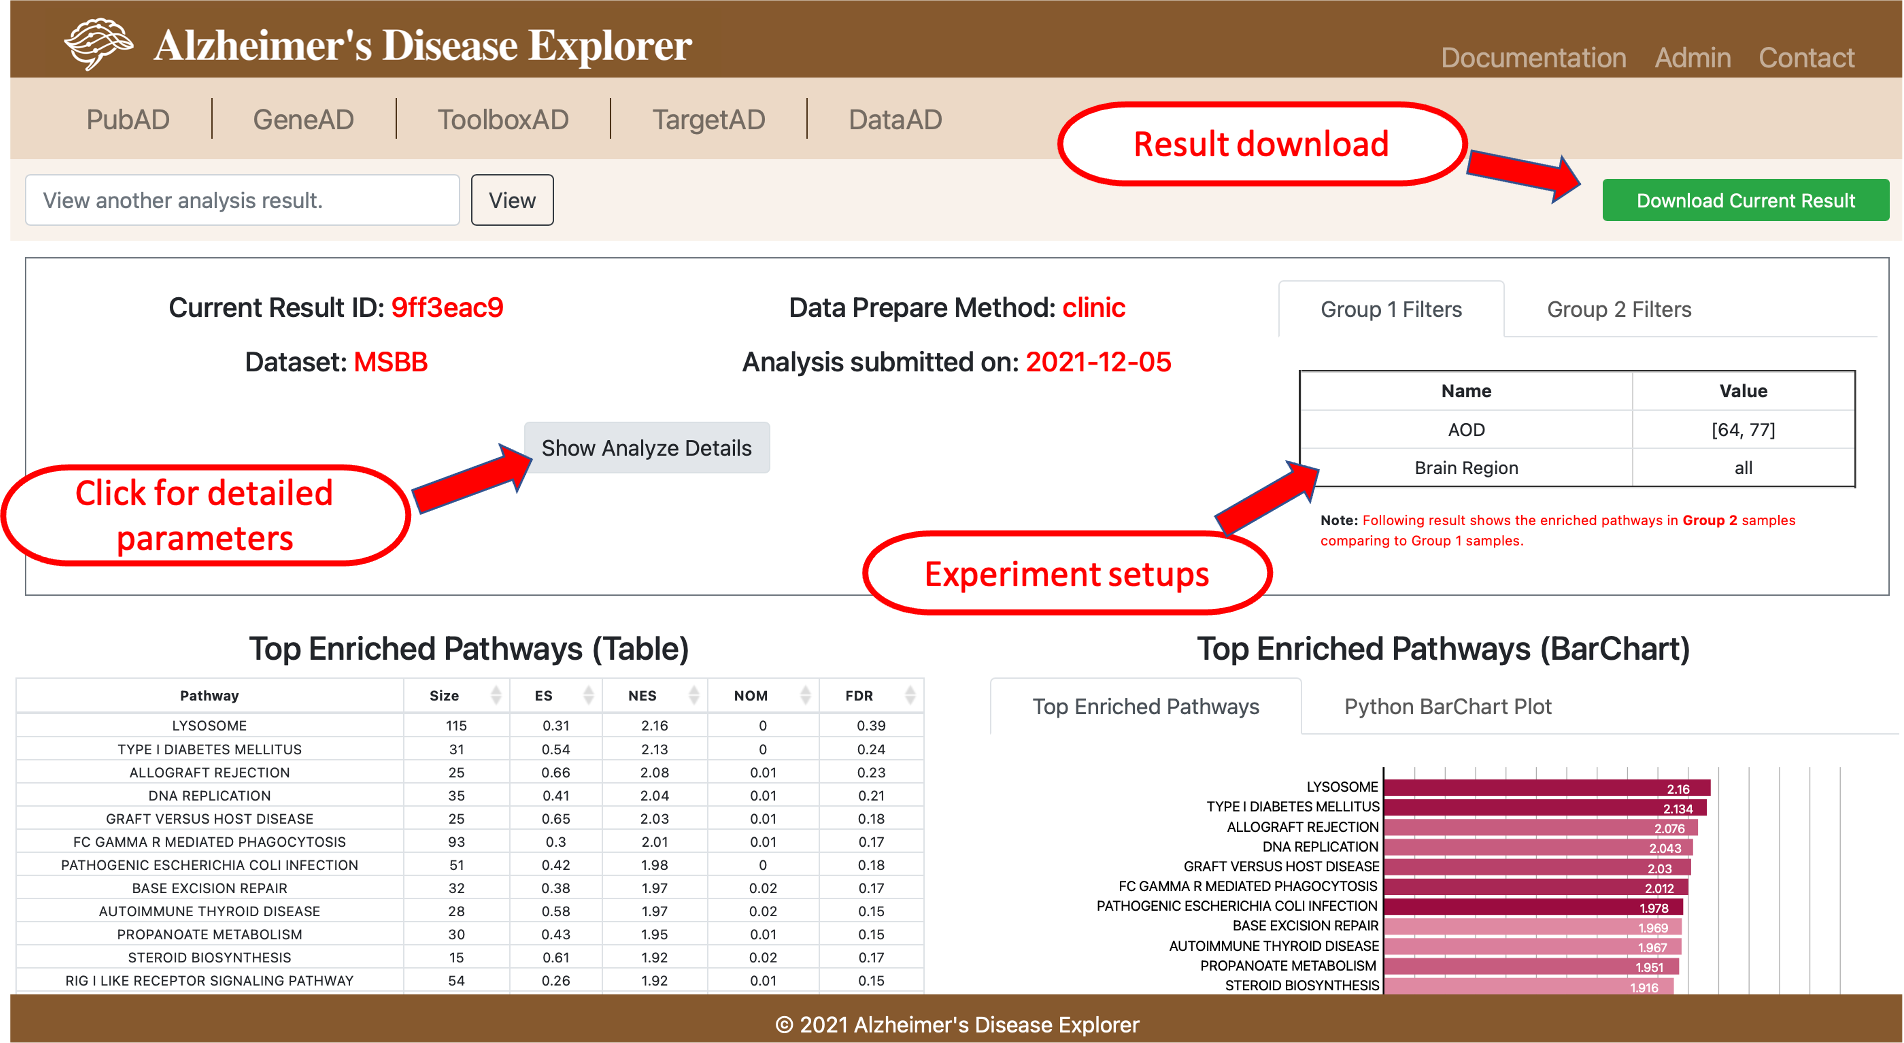
To view the OnlineGSEA result, users need to go to the ToolboxAD page, click the View Analyze Results button and provide the unique analysis ID provided when confirm the GSEA run, if am email is provided, users can also find the unique ID in the email. Detailed experiment setup will be shown on the top of the page, information includes dataset used, job submitted, experiment group setups, GSEA parameters, etc. Then a table of top 20 enriched pathways is shown below, a horizontal bar chart is plotted using normalized enrichment score and color coded with P value. To check more enrich pathways other than the top 20, users can use the Download Current Results button on the top to download the whole analysis results.
- 4.4 External Tools
Several external tools are list in ToolboxAD, all these tools are either focusing on AD research field or are able to run analysis using AD datasets. Tools that are currently list are: BioLearns, can be used for gene coexpression network module mining using GEO datasets. scREAD, is a single-cell RNA-Seq database for Alzheimer's Disease. Expression level in brain cells can be used for checking RNA expressions in different cell types in brain. More external tool will be linked in ToolboxAD.
5. TargetAD
TargetAD presents drug and target chemical information from multiple open resources and provide various visualizations supporting compiling AD drug target information and assisting with target enablement and druggability evaluation.
TargetAD can accept single or multiple genes query. HUGO Gene symbol or ENSEMBL ids are expected gene identifier to query TargetAD. The first section of the result page shows basic gene information, the last column of the table provided direct link to GeneAD and PubAD for each query gene. The next section of the result page provides a spider plot with 10 dimensions, these 10 dimensions are the information we integrated from multiple resources that can help a chemist to evaluate if a gene is a good potential target. With the help of the spider plot, chemist is able to compare potential targets using multi-dimensional information.
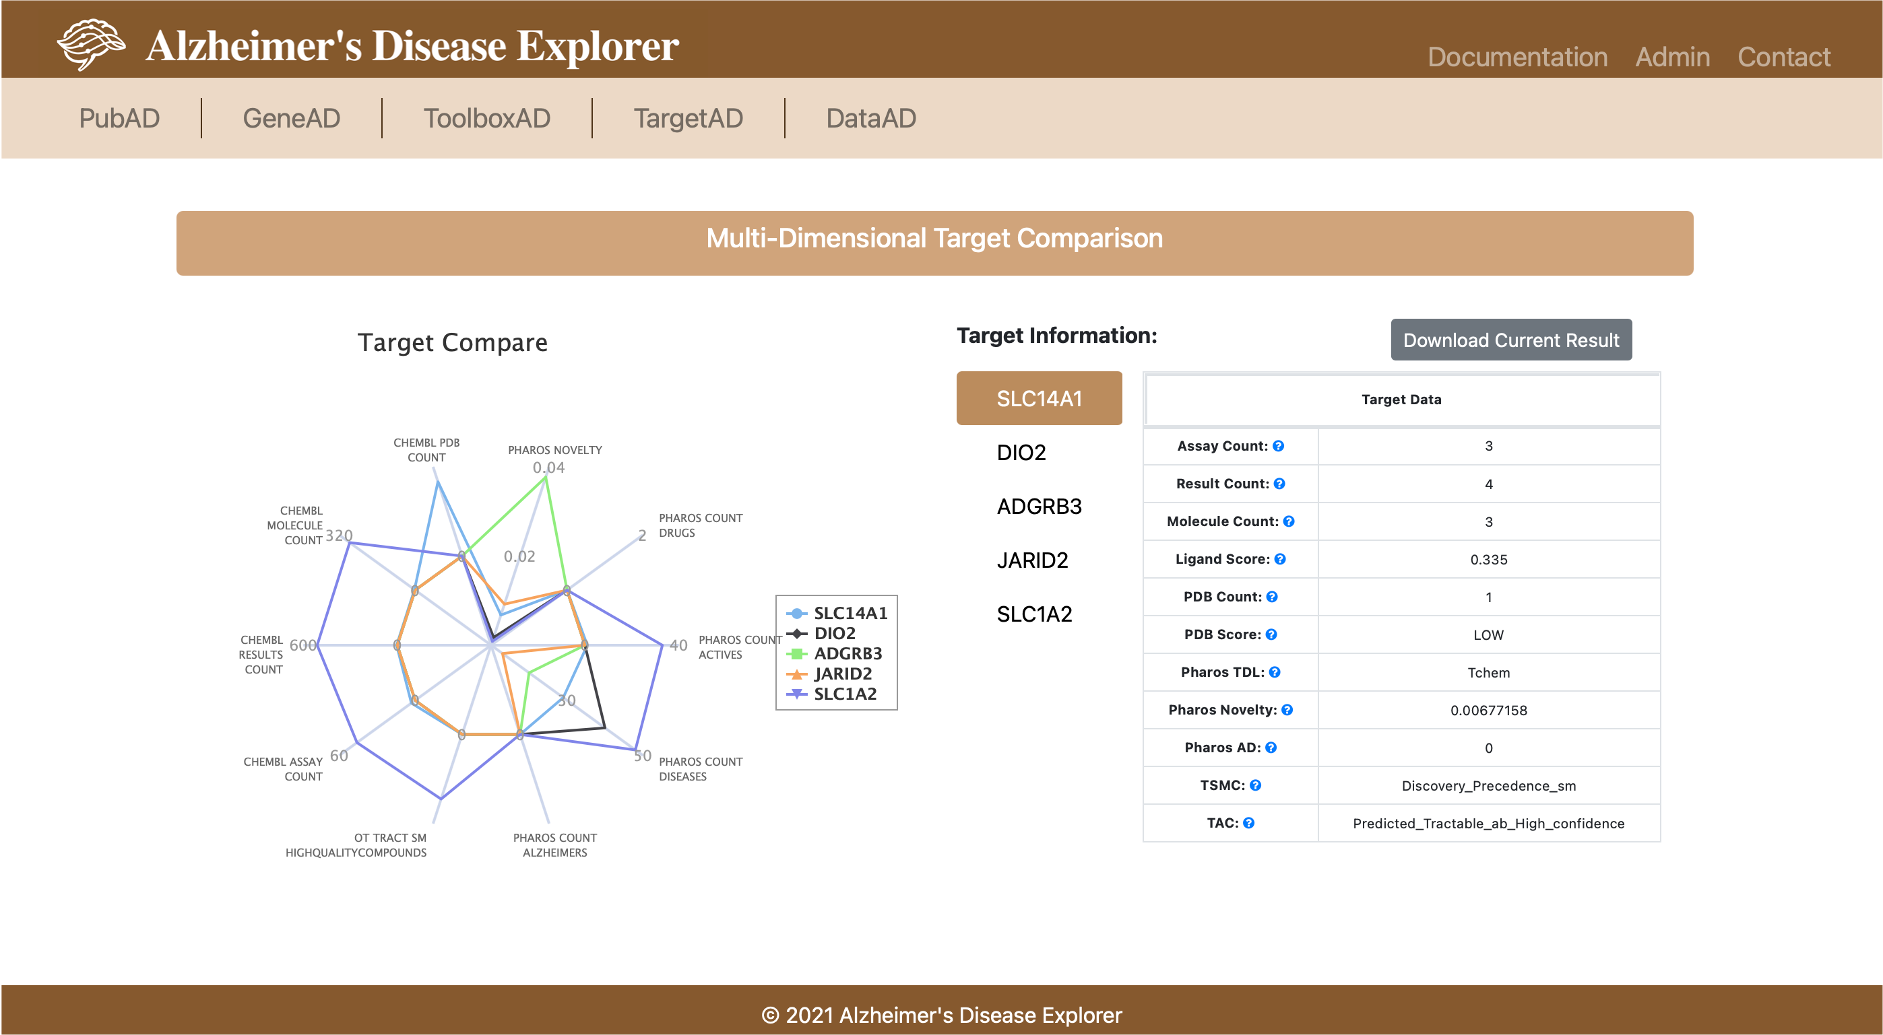
A table with all available information is provided on the right. All attributes used in this section is list in the table below:

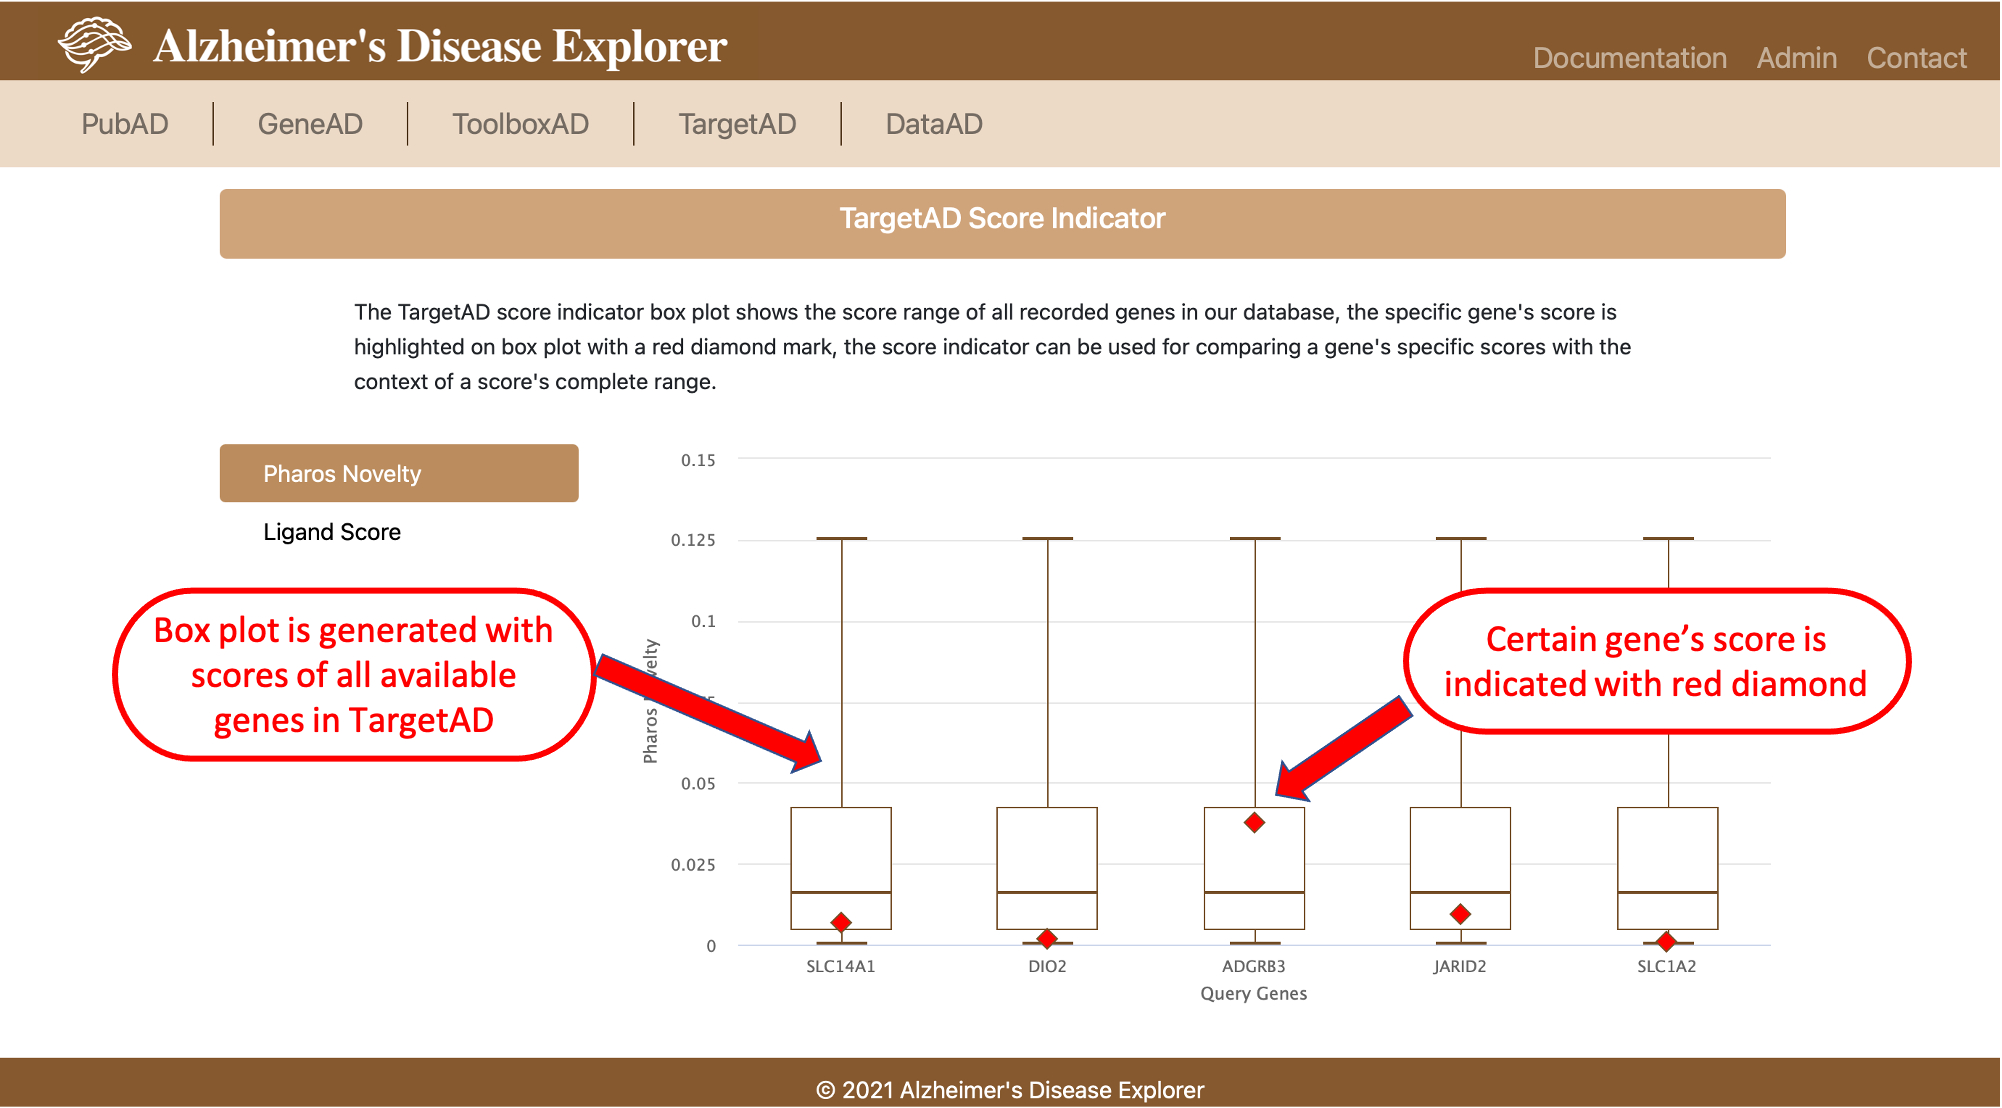
The last section of TargetAD provides score indicator function. For each float typed score, we generated a box plot of the score for all genes available in TargetAD, then we indicate the current query gene(s)'s score on box plot with a red diamond, so that users can clearly figure out whether a certain score is high or low according to the full range and distribution of the score.
6. DataAD
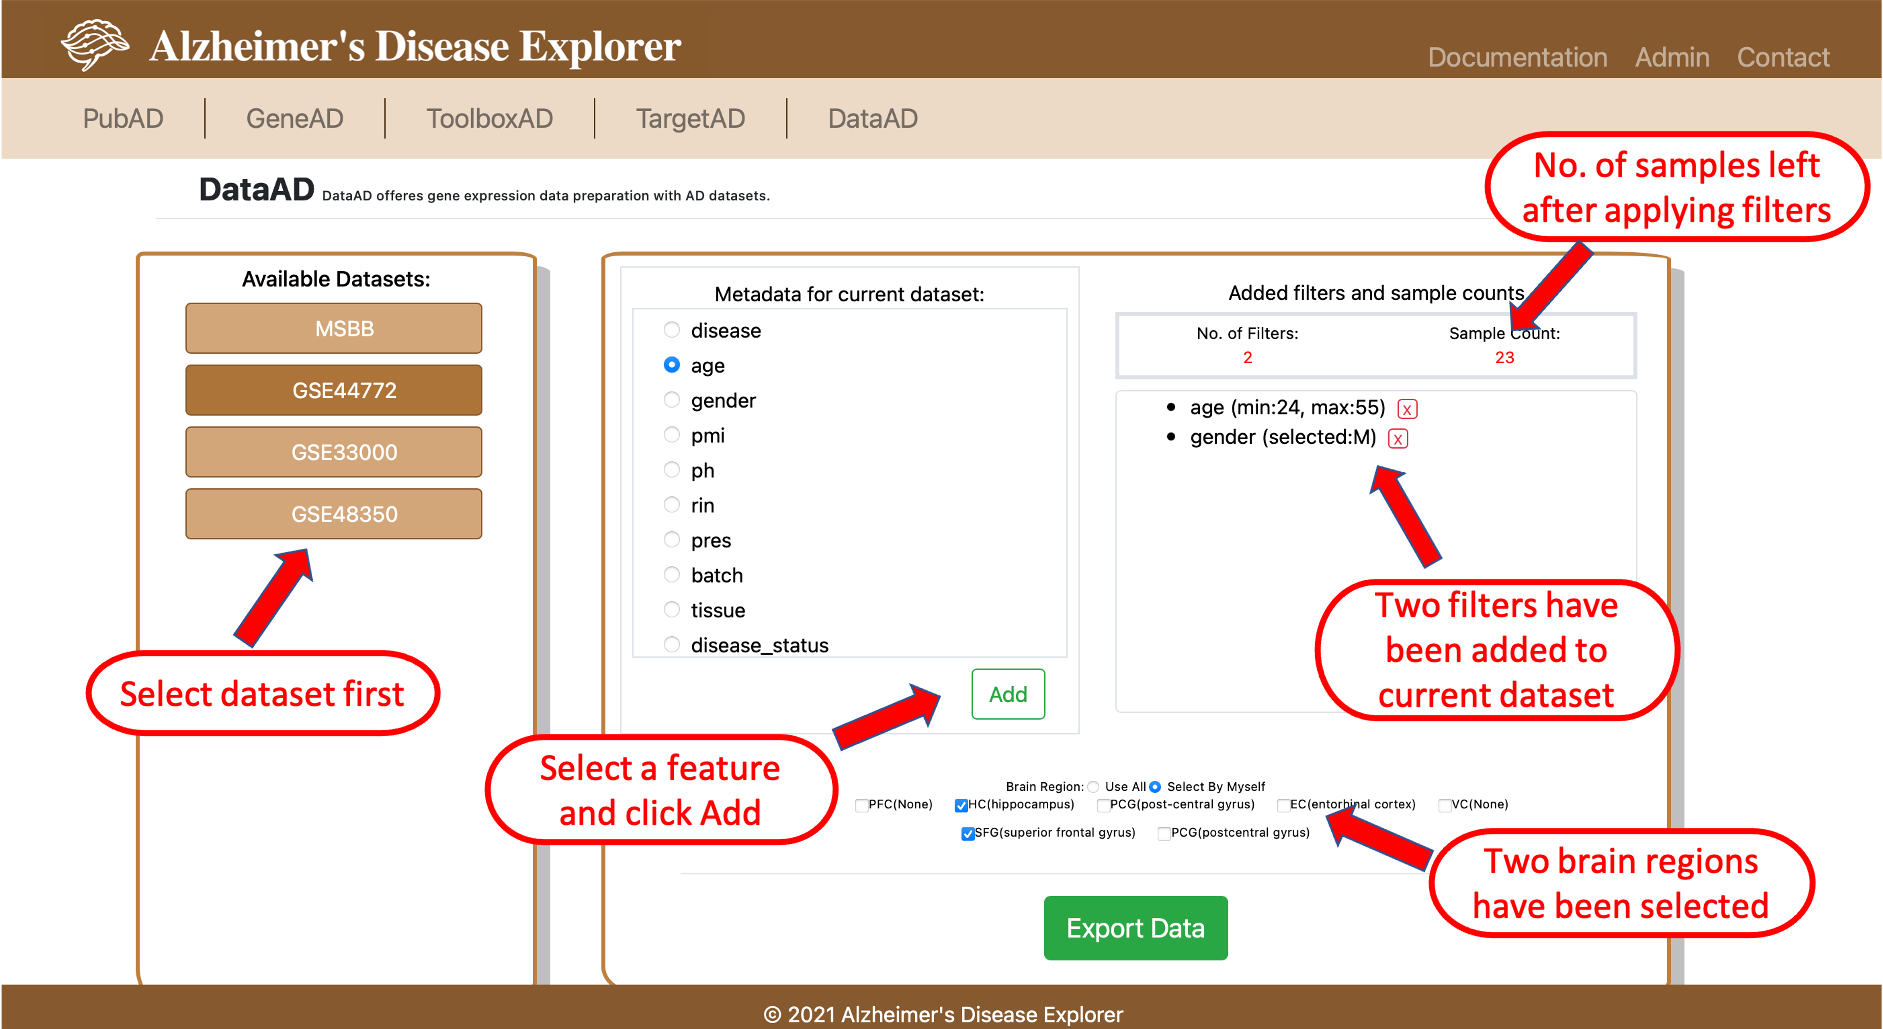
DataAD provides the function of filtering and exporting gene expression matrix according to each dataset's clinical information. Users are able to define filters according to their needs, then export the filtered gene expression matrix, DataAD's capability will significantly ease the data manipulation effort of researchers when they need certain subgroups of patients.
To use DataAD, users firstly need to select a dataset to work with, then the filter editing box on the right will be available. In the right side box, all available clinical features will be listed on the left, the right side window is used for monitoring all filters that have been added to the selected dataset, a number of patients left after applying all filters is indicated on top (red number). On the bottom part, users can select the brain regions as needed if this information is available for the selected dataset. Once all filters are added and brain regions are selected, users can clicl the Export Data button to export the gene expression matrix with all filters and brain regions applied, the downloaded file is in csv format, each column is a sample, each row is a gene.
7. Case Study
- 7.1 OnlineGSEA Case study
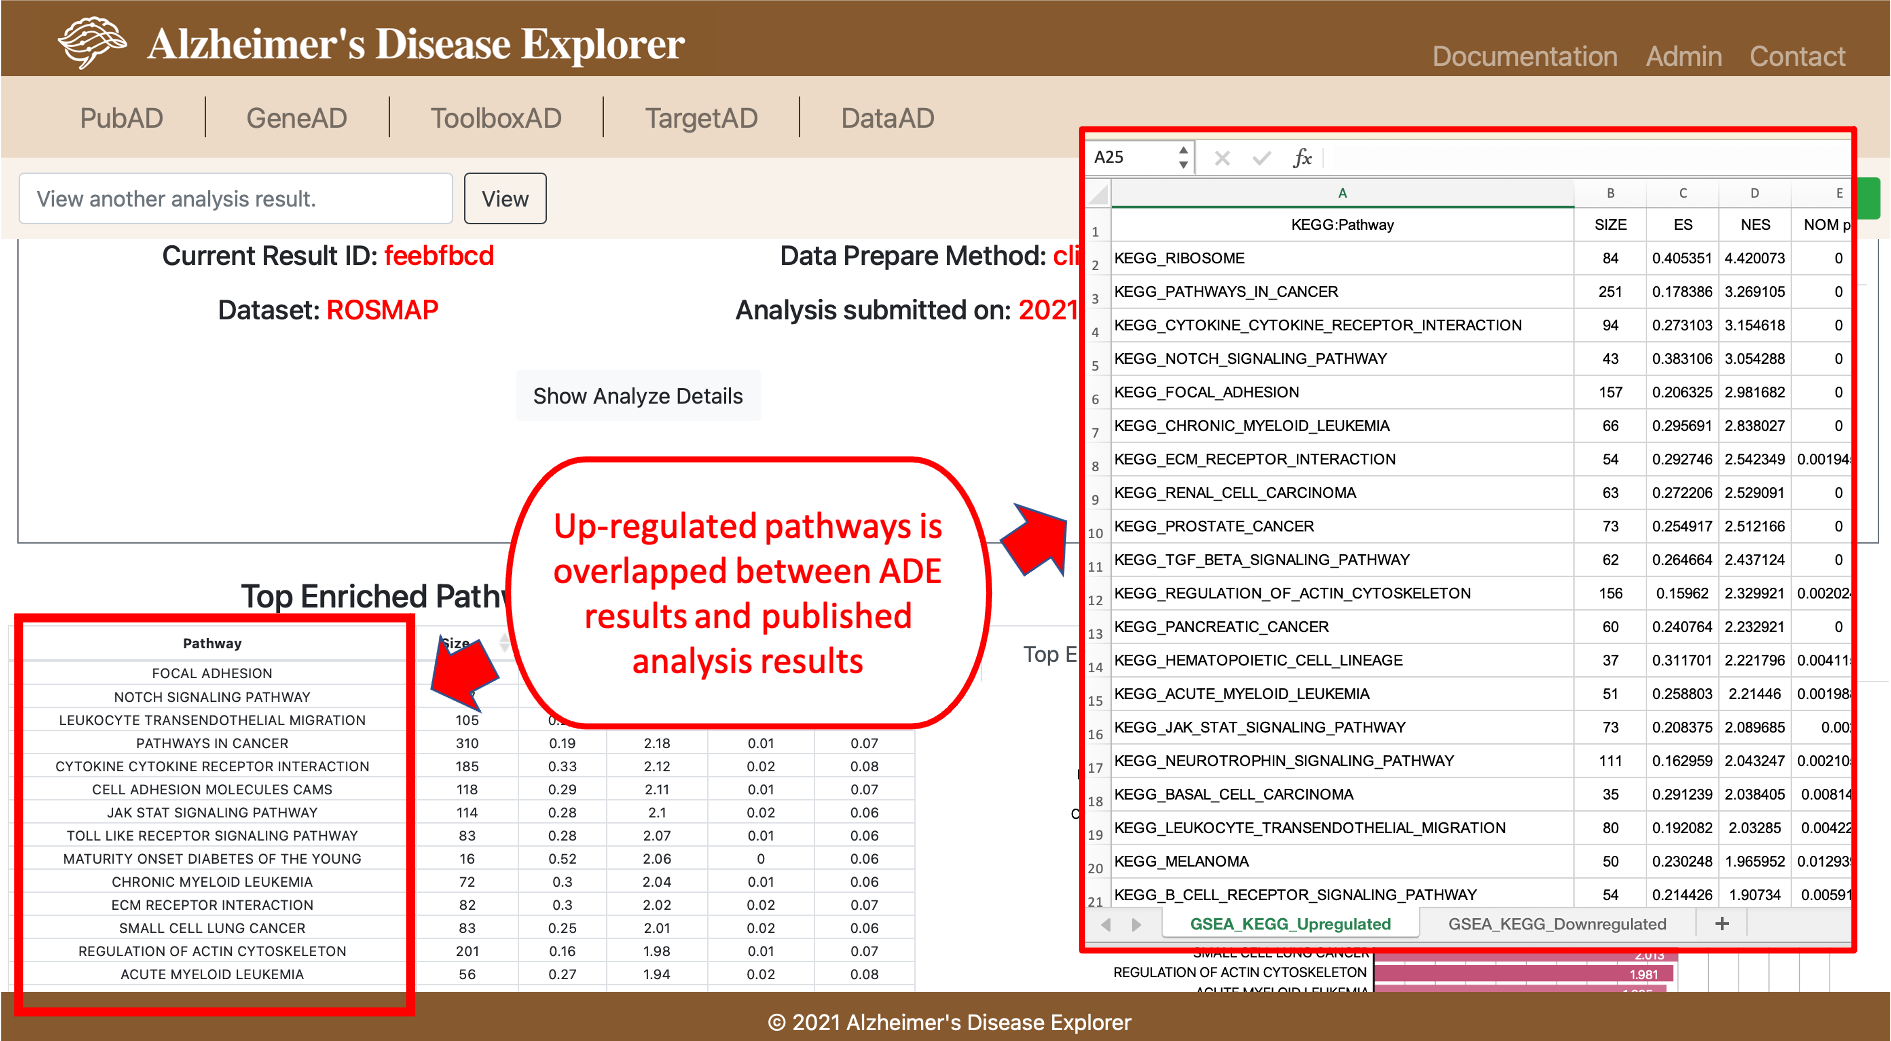
In this section, we provide a case study showing how researchers can utilize the functions in ADE to perform data analysis, the case study we used here is from a published journal paper. Canchi, Saranya, et al. (PMID: 31340147) performed Gene Set Enrichment Analysis between AD patients and Non Demented Controls (NDCs) to investigate the up or down regulated pathways in AD patients, their analysis can be found in the Excel file in Supplemental Information section. The dataset used by this study is ROSMAP dataset. The GSEA experiment setup is to set AD patients as test group and NDCs as control group, the clinical feature used for experiment is final consensus cognitive diagnosis (cogdx, reference can be found here), so in the ToolboxAD's OnlineGSEA tool, we will setup Group 2 as the AD patients, which means cogdc score between 4 and 6, the Group 1 will be NDCs so their cogdx should be 1 to 3. Then we run GSEA in ADE and the result can be found by using Analysis ID: feebfbcd or click the button below:
From the GSEA result page, we can see the top enriched pathways is largely overlapped with the published study, the slightly difference in top enriched pathways may caused by GSEA and KEGG versions used for the analysis. By using this case, study, we demonstrated that OnlineGSEA can be a easy to use tool for investigating pathway enrichment using integrated datasets. (Please note: the ROSMAP dataset is currently NOT available in ADE due the the restricted data usage of ROSMAP dataset).
8. FAQ
TBA